
MATLAB | 爱心图例与精致半透明圆角图例
~
本文中全部示意图均为本人自制,传播时请注明出处。
写了点小成品函数,比如如何绘制饼图时把图例上的图标变成心形:

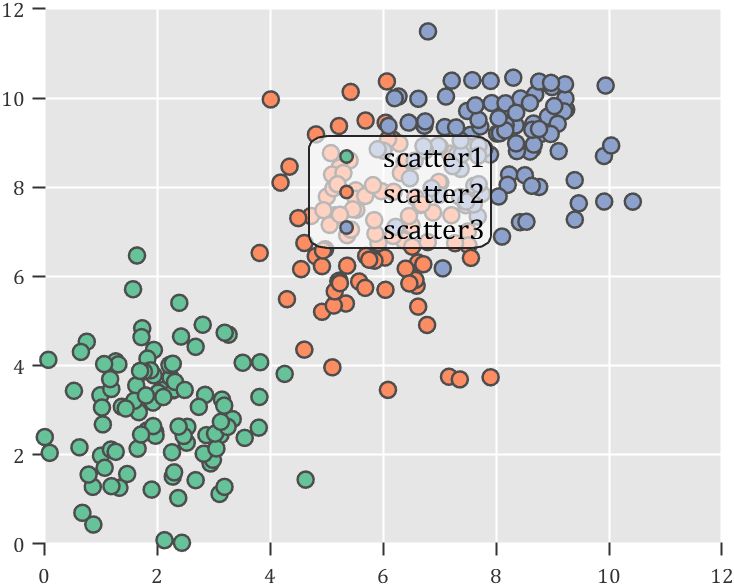
比如如何自制半透明圆角图例:

依旧先讲原理再给出这俩代码哈:
1 原理讲解-图形对象
封闭四边形对象
在之前文章我们已经讲到了legend组件的隐藏属性:

这个外框以及大部分情况下图例都是使用LineLoop以及Quadrilateral进行绘制:
这两种基础图形对象都是四个点为一组来绘制图形的,大概原理如下:
VertexData是顶点的坐标,是一个3xn大小的数组,第一行代表x坐标,第2、3行代表y、z坐标。范围为0-1。
每四个点为一组,例如如果有八个顶点,就会四个四个顶点为一组组成图形(1,2,3,4一组,5,6,7,8一组):

当然可以将点按顺序排放,或者设置VertexIndices就是顶点顺序来得到想要的四边形形状:

其他对象
对比于只能四个点为一组的对象,我们还要介绍更加灵活的对象,首先是LineStrip,这个图形对象会两点一组绘制直线:

而TriangleStrip就是三个点一组绘制填充三角形的对象,例如可以通过多个三角形填充复杂多边形:

2 原理讲解-创建与替换
讲一下怎么构造基础的图形对象,这些对象都是未公开的很底层的函数构造的,例如LineStrip,并不是通过:
- LineStrip()
来进行构建的,而是通过:
- matlab.graphics.primitive.world.LineStrip()
构建完对象后,必须设置以下属性才能让隐藏对象显示出来:
- Layer
- ColorBinding
- ColorData
- VertexData
- PickableParts
这些属性的设置可以参考原本的图例构成对象,在此不做详述,也可参考本人写的代码。
之后将新构造的对象父类设置成原本组件的Group父类,再将原本组件隐藏即可:
newBoxEdgeHdl.Parent=oriBoxEdgeHdl.Parent;
oriBoxEdgeHdl.Visible='off';
以上就是进行组件替换的全部流程,写了两段示例代码:
3 示例代码
半透明图例
function SPrettyLegend(lgd)
% Semitransparent rounded rectangle legend
% Copyright (c) 2023, Zhaoxu Liu / slandarer
% -------------------------------------------------------------------------
% Zhaoxu Liu / slandarer (2023). pretty legend
% (https://www.mathworks.com/matlabcentral/fileexchange/132128-pretty-legend),
% MATLAB Central File Exchange. 检索来源 2023/7/9.
% =========================================================================
if nargin<1
    ax = gca;
    lgd = get(ax,'Legend');
end
pause(1e-6)
Ratio = .1;
t1 = linspace(0,pi/2,4); t1 = t1([1,2,2,3,3,4]);
t2 = linspace(pi/2,pi,4); t2 = t2([1,2,2,3,3,4]);
t3 = linspace(pi,3*pi/2,4); t3 = t3([1,2,2,3,3,4]);
t4 = linspace(3*pi/2,2*pi,4); t4 = t4([1,2,2,3,3,4]);
XX = [1,1,1-Ratio+cos(t1).*Ratio,1-Ratio,Ratio,Ratio+cos(t2).*Ratio,...
    0,0,Ratio+cos(t3).*Ratio,Ratio,1-Ratio,1-Ratio+cos(t4).*Ratio];
YY = [Ratio,1-Ratio,1-Ratio+sin(t1).*Ratio,1,1,1-Ratio+sin(t2).*Ratio,...
    1-Ratio,Ratio,Ratio+sin(t3).*Ratio,0,0,Ratio+sin(t4).*Ratio];
% 圆角边框(border-radius)
oriBoxEdgeHdl = lgd.BoxEdge;
newBoxEdgeHdl = matlab.graphics.primitive.world.LineStrip();
newBoxEdgeHdl.AlignVertexCenters = 'off';
newBoxEdgeHdl.Layer = 'front';
newBoxEdgeHdl.ColorBinding = 'object';
newBoxEdgeHdl.LineWidth = 1;
newBoxEdgeHdl.LineJoin = 'miter';
newBoxEdgeHdl.WideLineRenderingHint = 'software';
newBoxEdgeHdl.ColorData = uint8([38;38;38;0]);
newBoxEdgeHdl.VertexData = single([XX;YY;XX.*0]);
newBoxEdgeHdl.Parent=oriBoxEdgeHdl.Parent;
oriBoxEdgeHdl.Visible='off';
% 半透明圆角背景(Semitransparent rounded background)
oriBoxFaceHdl = lgd.BoxFace;
newBoxFaceHdl = matlab.graphics.primitive.world.TriangleStrip();
Ind = [1:(length(XX)-1);ones(1,length(XX)-1).*(length(XX)+1);2:length(XX)];
Ind = Ind(:).';
newBoxFaceHdl.PickableParts = 'all';
newBoxFaceHdl.Layer = 'back';
newBoxFaceHdl.ColorBinding = 'object';
newBoxFaceHdl.ColorType = 'truecoloralpha';
newBoxFaceHdl.ColorData = uint8(255*[1;1;1;.6]);
newBoxFaceHdl.VertexData = single([XX,.5;YY,.5;XX.*0,0]);
newBoxFaceHdl.VertexIndices = uint32(Ind);
newBoxFaceHdl.Parent = oriBoxFaceHdl.Parent;
oriBoxFaceHdl.Visible = 'off';
end
使用示例
clc; clear; close all
rng(12)
% 生成随机点(Generate random points)
mu = [2 3; 6 7; 8 9];
S  = cat(3,[1 0; 0 2],[1 0; 0 2],[1 0; 0 1]);
r1 = abs(mvnrnd(mu(1,:),S(:,:,1),100));
r2 = abs(mvnrnd(mu(2,:),S(:,:,2),100));
r3 = abs(mvnrnd(mu(3,:),S(:,:,3),100));
% 绘制散点图(Draw scatter chart)
hold on
propCell = {'LineWidth',1.2,'MarkerEdgeColor',[.3,.3,.3],'SizeData',60};
scatter(r1(:,1),r1(:,2),'filled','CData',[0.40 0.76 0.60],propCell{:});
scatter(r2(:,1),r2(:,2),'filled','CData',[0.99 0.55 0.38],propCell{:});
scatter(r3(:,1),r3(:,2),'filled','CData',[0.55 0.63 0.80],propCell{:});
% 增添图例(Draw legend)
lgd = legend('scatter1','scatter2','scatter3');
lgd.Location = 'northwest';
lgd.FontSize = 14;
% 坐标区域基础修饰(Axes basic decoration)
ax=gca; grid on
ax.FontName   = 'Cambria';
ax.Color      = [0.9,0.9,0.9];
ax.Box        = 'off';
ax.TickDir    = 'out';
ax.GridColor  = [1 1 1];
ax.GridAlpha  = 1;
ax.LineWidth  = 1;
ax.XColor     = [0.2,0.2,0.2];
ax.YColor     = [0.2,0.2,0.2];
ax.TickLength = [0.015 0.025];
% 隐藏轴线(Hide XY-Ruler)
pause(1e-6)
ax.XRuler.Axle.LineStyle = 'none';
ax.YRuler.Axle.LineStyle = 'none';

SPrettyLegend(lgd)

心形图例(饼图专属)
function pie2HeartLegend(lgd)
% Heart shaped legend for pie chart
% Copyright (c) 2023, Zhaoxu Liu / slandarer
% =========================================================================
if nargin<1
    ax = gca;
    lgd = get(ax,'Legend');
end
pause(1e-6)
% 心形曲线(Heart curve)
x = -1:1/100:1;
y1 = 0.6 * abs(x) .^ 0.5 + ((1 - x .^ 2) / 2) .^ 0.5;
y2 = 0.6 * abs(x) .^ 0.5 - ((1 - x .^ 2) / 2) .^ 0.5;
XX = [x, flip(x),x(1)]./3.4+.5;
YY = ([y1, y2,y1(1)]-.2)./2+.5;
Ind = [1:(length(XX)-1);2:length(XX)];
Ind = Ind(:).';
% 获取图例图标(Get Legend Icon)
lgdEntryChild = lgd.EntryContainer.NodeChildren;
iconSet = arrayfun(@(lgdEntryChild)lgdEntryChild.Icon.Transform.Children.Children,lgdEntryChild,UniformOutput=false);
% 基础边框句柄(Base Border Handle)
newEdgeHdl = matlab.graphics.primitive.world.LineStrip();
newEdgeHdl.AlignVertexCenters = 'off';
newEdgeHdl.Layer = 'front';
newEdgeHdl.ColorBinding = 'object';
newEdgeHdl.LineWidth = .8;
newEdgeHdl.LineJoin = 'miter';
newEdgeHdl.WideLineRenderingHint = 'software';
newEdgeHdl.ColorData = uint8([38;38;38;0]);
newEdgeHdl.VertexData = single([XX;YY;XX.*0]);
newEdgeHdl.VertexIndices = uint32(Ind);
% 基础多边形面句柄(Base Patch Handle)
newFaceHdl = matlab.graphics.primitive.world.TriangleStrip();
Ind = [1:(length(XX)-1);ones(1,length(XX)-1).*(length(XX)+1);2:length(XX)];
Ind = Ind(:).';
newFaceHdl.PickableParts = 'all';
newFaceHdl.Layer = 'middle';
newFaceHdl.ColorBinding = 'object';
newFaceHdl.ColorType = 'truecoloralpha';
newFaceHdl.ColorData = uint8(255*[1;1;1;.6]);
newFaceHdl.VertexData = single([XX,.5;YY,.5;XX.*0,0]);
newFaceHdl.VertexIndices = uint32(Ind);
% 替换图例图标(Replace Legend Icon)
for i = 1:length(iconSet)
    oriEdgeHdl = iconSet{i}(1);
    tNewEdgeHdl = copy(newEdgeHdl);
    tNewEdgeHdl.ColorData = oriEdgeHdl.ColorData;
    tNewEdgeHdl.Parent = oriEdgeHdl.Parent;
    oriEdgeHdl.Visible = 'off';

    oriFaceHdl = iconSet{i}(2);
    tNewFaceHdl = copy(newFaceHdl);
    tNewFaceHdl.ColorData = oriFaceHdl.ColorData;
    tNewFaceHdl.Parent = oriFaceHdl.Parent;
    oriFaceHdl.Visible = 'off';
end
end
使用示例
clc; clear; close all
% 生成随机点(Generate random points)
X = [1 3 0.5 2.5 2];
pieHdl = pie(X);

% 修饰饼状图(Decorate pie chart)
colorList=[0.4941    0.5490    0.4118
    0.9059    0.6510    0.3333
    0.8980    0.6157    0.4980
    0.8902    0.5137    0.4667
    0.4275    0.2824    0.2784];
for i = 1:2:length(pieHdl)
    pieHdl(i).FaceColor=colorList((i+1)/2,:);
    pieHdl(i).EdgeColor=colorList((i+1)/2,:);
    pieHdl(i).LineWidth=1;
    pieHdl(i).FaceAlpha=.6;
end
for i = 2:2:length(pieHdl)
    pieHdl(i).FontSize=13;
    pieHdl(i).FontName='Times New Roman';
end
lgd=legend('FontSize',13,'FontName','Times New Roman','TextColor',[1,1,1].*.3);

pie2HeartLegend(lgd)

完
以上已是本文做出的全部探索,本人应该是全网第一位给出修改图例可行方法的人,通过上述方法,阴影柱状图图例等特殊图例的绘制也变成了可能,期待大家的二次创作哈

长江两岸老火锅,共聚山城开发者!We Want You!
更多推荐


 6
6 0
0- 0


 已为社区贡献2条内容

所有评论(0)