
机器学习-决策树(python)
决策树(Decision Tree)是在已知各种情况发生概率的上,通过构成决策树来求取净现值的值大于等于零的概率,评价项目风险,判断其可行性的决策分析方法,是直观运用概率分析的一种图解法。由于这种决策分支画成图形很像一棵树的枝干,故称决策树。在机器学习中,决策树是一个预测模型,他代表的是对象属性与对象值之间的一种映射关系。Entropy = 系统的凌乱程度,使用算法,和C5.0生成树算法使用熵。这
何为决策树?
决策树(Decision Tree)是在已知各种情况发生概率的基础上,通过构成决策树来求取净现值的期望值大于等于零的概率,评价项目风险,判断其可行性的决策分析方法,是直观运用概率分析的一种图解法。由于这种决策分支画成图形很像一棵树的枝干,故称决策树。在机器学习中,决策树是一个预测模型,他代表的是对象属性与对象值之间的一种映射关系。Entropy = 系统的凌乱程度,使用算法ID3, C4.5和C5.0生成树算法使用熵。这一度量是基于信息学理论中熵的概念。
决策树是一种树形结构,其中每个内部节点表示一个属性上的测试,每个分支代表一个测试输出,每个叶节点代表一种类别。
分类树(决策树)是一种十分常用的分类方法。它是一种监督学习,所谓监督学习就是给定一堆样本,每个样本都有一组属性和一个类别,这些类别是事先确定的,那么通过学习得到一个分类器,这个分类器能够对新出现的对象给出正确的分类。这样的机器学习就被称之为监督学习。
决策树的流程
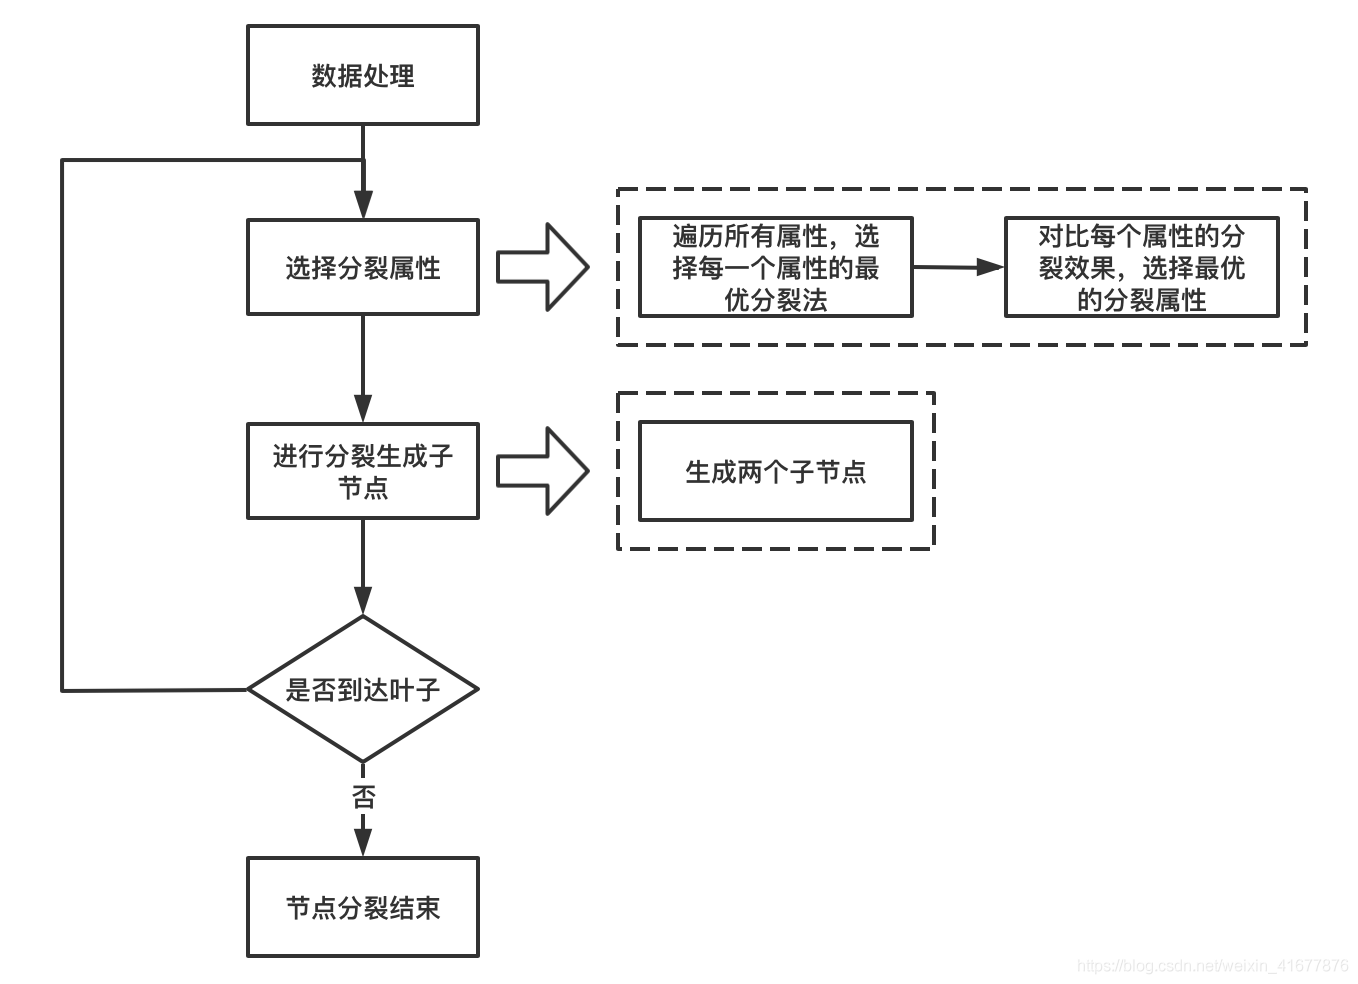
第1步;数据准备:通过数据清洗和数据处理,将数据被理为没有缺省值的向量,第2步:寻找最佳特征:遍历每个特征的每一种划分方式,找到最好的划分特征。第3步:生成分支:划分成两个或多个节点。第4步:生成决策树:对分裂后的节点分别继续执行2-3步,直到每个节点只有一种类别。第5步:决策分类:根据训练决策树模型,将预测数据进行分类。
特征的选择--信息增益
在信息增益中,衡量标准是看特征能够为分类系统带来多少信息,带来的信息越多,该特征越重要。对一个特征而言,系统有它和没它时信息量将发生变化,而前后信息量的差值就是这个特征给系统带来的信息量。所谓信息量,就是熵。
假如有特征D,其可能的取值有k种,每一种取到的概率为Pi,那么D的熵就定义为
计算过熵后,怎么计算信息增益呢?信息增益的计算就是将父节点的熵减去其下所有子节点的熵之和,并且在求和时,由于类别比重不同,需要对其实现加权平均。
决策树的实现(通过一些特征辨别性别)
数据处理
数据来源集美大学同学,特别感谢集美大学同学能够免费回答我的问卷。
数据类别:身高,体重,年龄,脚码,性别
数据处理:对数据的类别进行分级,以每列数据的平均值来作为分级的标准
def dealData(filename):
    fr = open(filename,'r',encoding='utf-8-sig')
    arrayOLines = fr.readlines()
    numberOfLines = len(arrayOLines)
    data = np.zeros((numberOfLines, 5))
    index = 0
    for line in arrayOLines:
        line = line.strip()
        listFromLine = line.split('\t')
        data[index,:] = listFromLine[0:5]
        index += 1

   #对数据特征进行分类
    for j in range(4):
        for i in range(numberOfLines):
            #身高
            if(j==0):
                if(data[i][j])>1.69:data[i][j]=3
                elif(data[i][j]==1.69):data[i][j]=2
                else:data[i][j]=1
            #体重
            if(j==1):
                if(data[i][j])>64:data[i][j]=3
                elif(data[i][j]==64):data[i][j]=2
                else:data[i][j]=1
            #年龄
            if(j==2):
                if(data[i][j])>26:data[i][j]=3
                elif(data[i][j]==26):data[i][j]=2
                else:data[i][j]=1
            #脚码
            if(j==3):
                if(data[i][j])>32:data[i][j]=3
                elif(data[i][j]==32):data[i][j]=2
                else:data[i][j]=1
    return data
构建决策树(参考《机器学习实战》代码)
计算给定数据集的信息熵:
#计算给定数据集的信息熵
def calcEntroy(dataSet):
    numEntroy=len(dataSet)
    labelCounts={}
    for featVec in dataSet:
        currentLabel=featVec[-1]
        if currentLabel not in labelCounts.keys():  #labelCounts.keys()表示返回labelCounts字典的键列表
            labelCounts[currentLabel]=0 #将字典不存在的键添加到字典中并且给键值赋初值
        labelCounts[currentLabel]+=1 #记录当前类别的出现的次数
    Entroy=0.0
    '''计算信息熵'''
    for key in labelCounts:
        prob=float(labelCounts[key])/numEntroy
        Entroy-=prob*log(prob,2)
    return Entroy
按照给定特征划分数据集:
#按照给定特征划分数据集
def splitDataSet(dataSet,axis,value):
    retDataSet=[]
    if isinstance(dataSet,list)==False:
        dataSet=dataSet.tolist()
    for featVec in dataSet:
        if featVec[axis]== value:
            reducedFeatVec=featVec[:axis]
            reducedFeatVec.extend(featVec[axis+1:])
            retDataSet.append(reducedFeatVec)
    return retDataSet
选择最好的数据集划分方式 :
#选择最好的数据集划分方式
def chooseBestFeatureToSplit(dataSet):
    numFeatures=len(dataSet[0])-1 #数据集最好一项是标签,而前len(dataSet[0])-1表示数据特征数
    baseEntropy = calcEntroy(dataSet)
    bestInfoGain=0.0; bestFeature=-1
    for i in range(numFeatures):
        featList=[example[i] for example in dataSet]
        uniqueVals=set(featList) #创建一个无序重复元素集
        newEntropy=0.0
        '''计算每种划分方法的信息熵'''
        for value in uniqueVals:
            subDataSet=splitDataSet(dataSet,i,value)
            prob=len(subDataSet)/float(len(dataSet))
            newEntropy+=prob*calcEntroy(subDataSet)
        infoGain=baseEntropy-newEntropy
        if (infoGain>bestInfoGain):
            bestInfoGain=infoGain
            bestFeature=i
    #返回最好特征划分的索引值
    return bestFeature
计算出现次数最多的分类名称:
#计算出现次数最多的分类名称
def majorityVCnt(classList):
    classCount={}
    for vote in classList:
        if vote not in classCount.keys():
            classCount[vote]=0
        classCount[vote]+=1
    sortedClassCount=sorted(classCount.items(),key=operator.itemgetter(1),reverse=True)
    return sortedClassCount[0][0]
构建决策树函数 :
#构建决策树函数
def createTree(dataSet,labels):
    classList=[example[-1] for example in dataSet] #用索引的-1位置表示列表最后的位置
    #如果第一个类别的数目=整个数据集的长度,即整个数据集只有一个类别,可以直接返回该类标签
    #第一个停止条件
    if classList.count(classList[0])==len(classList):
        return classList[0]
    #如果数据集只有一列,则无法简单的返回唯一的类标签,这里使用前面介绍的majorityCnt函数挑选出现次数最多的类别作为返回值
    if len(dataSet[0])==1:
        return majorityVCnt(classList)
    #获取数据集中最好特征划分的索引
    bestFeatSplitIndex=chooseBestFeatureToSplit(dataSet)
    #获取最好特征所属类别标签
    bestFeatLabel=labels[bestFeatSplitIndex]
    #初始化myTree
    myTree={bestFeatLabel:{}}
    del(labels[bestFeatSplitIndex])
    #获取数据集中最优的列
    featValues=[example[bestFeatSplitIndex] for example in dataSet]
    uniqueVals=set(featValues)
    for value in uniqueVals:
        #求出剩余的类标签
        subLables=labels[:]
        #遍历当前选择特征包含的所有属性值,递归调用createTree()函数
        myTree[bestFeatLabel][value]=createTree(splitDataSet(dataSet,bestFeatSplitIndex,value),subLables)
    return myTree
使用Matplotlib注解绘制树形图 :
import matplotlib.pyplot as plt

#定义文本框和箭头格式
decisionNode=dict(boxstyle="sawtooth",fc='0.8')
leafNode=dict(boxstyle="round4",fc='0.8')
arrow_args=dict(arrowstyle="<-")

#绘制带箭头的注释
def plotNode(nodeTxt,centerPt,parentPt,nodeType):
    createPlot.axl.annotate(nodeTxt,xy=parentPt,xycoords='axes fraction',
    xytext=centerPt,
    textcoords='axes fraction',
    va="center",ha="center",bbox=nodeType,arrowprops=arrow_args)

#获取叶节点的数目和树的层数
def getNumLeafs(myTree):
    numLeafs=0
#  firstStr=myTree.keys()[0]
    firstStr=list(myTree.keys())[0]
    secondDict=myTree[firstStr]
    for key in secondDict.keys():
        if type(secondDict[key]).__name__=='dict':
            numLeafs+=getNumLeafs(secondDict[key])
        else:
            numLeafs+=1
    return numLeafs

def getTreeDepth(myTree):
    maxDepth=0
    firstStr=list(myTree.keys())[0]
    secondDict=myTree[firstStr]
    for key in secondDict.keys():
        if type(secondDict[key]).__name__=='dict':
            thisDepth=1+getTreeDepth(secondDict[key])
        else:
            thisDepth=1
        if thisDepth>maxDepth:maxDepth=thisDepth
    return maxDepth


def plotMidText(cntrPt,parentPt,txtString):
    xMid=(parentPt[0]-cntrPt[0])/2.0+cntrPt[0]
    yMid=(parentPt[1]-cntrPt[1])/2.0+cntrPt[1]
    createPlot.axl.text(xMid,yMid,txtString)

def plotTree(mytree,parentPt,nodeTxt):
    numLeafs=getNumLeafs(mytree)
    depth=getTreeDepth(mytree)
    firstStr=list(mytree.keys())[0]
    cntrPt=(plotTree.xOff+(1.0+float(numLeafs))/2.0/plotTree.totalW,plotTree.yOff)
    plotMidText(cntrPt,parentPt,nodeTxt)
    plotNode(firstStr,cntrPt,parentPt,decisionNode)
    secondDict=mytree[firstStr]
    plotTree.yOff=plotTree.yOff-1.0/plotTree.totalD
    for key in secondDict.keys():
        if type(secondDict[key]).__name__=='dict':
            plotTree(secondDict[key],cntrPt,str(key))
        else:
            plotTree.xOff=plotTree.xOff+1.0/plotTree.totalW
            plotNode(secondDict[key],(plotTree.xOff,plotTree.yOff),cntrPt,leafNode)
            plotMidText((plotTree.xOff,plotTree.yOff),cntrPt,str(key))
    plotTree.yOff=plotTree.yOff+1.0/plotTree.totalD


def createPlot(inTree):
    fig=plt.figure(1,facecolor='white')
    fig.clf()
    axprops=dict(xticks=[],yticks=[])
    createPlot.axl=plt.subplot(111,frameon=False,**axprops)
    plotTree.totalW=float(getNumLeafs(inTree))
    plotTree.totalD=float(getTreeDepth(inTree))
    plotTree.xOff=-0.5/plotTree.totalW;plotTree.yOff=1.0;plotTree(inTree,(0.5,1.0),'')
    plt.show()
代码测试:
if __name__=='__main__':
    labels=['high','weight','age','subdcript','sex']
    data=dealData('D:/learn/three first/machine learning/Data1.txt')
    myTree=createTree(data,labels)
    print(myTree)
    createPlot(myTree)
实现结果:
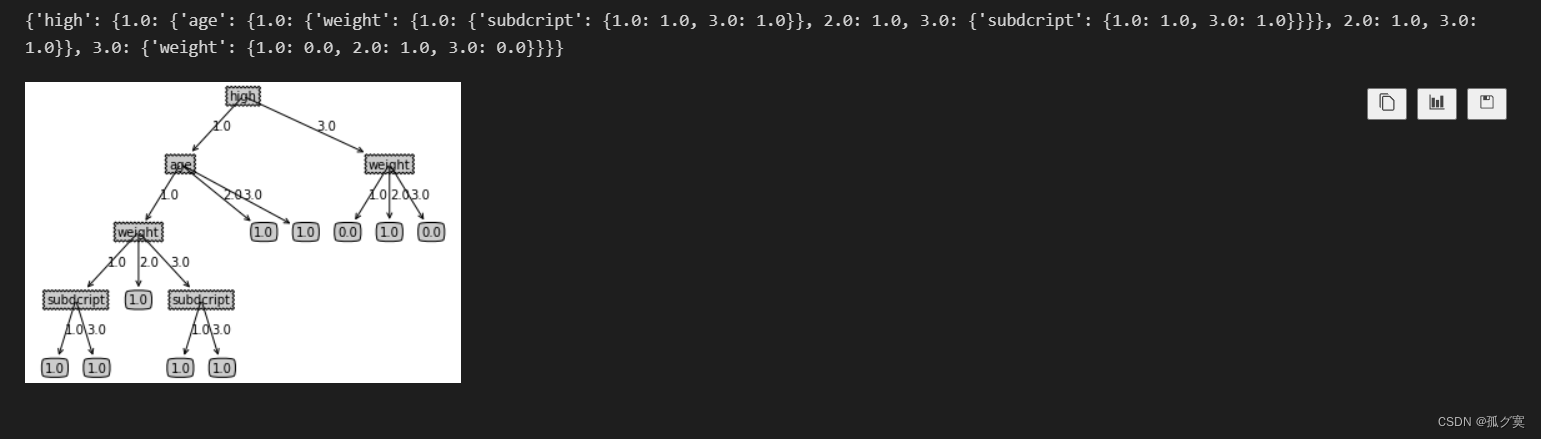
结果分析:
从决策树可以看出身高的信息增益对性别判别最大,当身高等级为1时,年龄的信息增益最大;为3时,体重增益最大。当年龄等级为1时体重增益最大,最后分配脚码。
不足:数据过于少,对数据类型的分级不够好,应采用更准确的方法来分类,而不是通过平均数来分级。
决策树的优缺点:
优点:决策树算法的时间复杂度较小,可以处理不相关特征数据。
缺点:容易出现过拟合对连续性的字段比较难预测
更多推荐


 23
23 0
0- 0


 已为社区贡献1条内容

所有评论(0)