使用 matplotlib 堆叠的 3d 条形图
·
回答问题
我使用以下代码制作了一个简单的 3d 条形图:
from mpl_toolkits.mplot3d import Axes3D
import matplotlib.pyplot as plt
import numpy as np

fig = plt.figure()
ax = fig.add_subplot(111, projection = "3d")

ax.set_xlabel("x")
ax.set_ylabel("y")
ax.set_zlabel("z")
ax.set_xlim3d(0,10)
ax.set_ylim3d(0,10)
ax.set_zlim3d(0,2)

xpos = [2,5,8,2,5,8,2,5,8]
ypos = [1,1,1,5,5,5,9,9,9]
zpos = np.zeros(9)

dx = np.ones(9)
dy = np.ones(9)
dz = np.ones(9)

ax.bar3d(xpos, ypos, zpos, dx, dy, dz)
plt.gca().invert_xaxis()
plt.show()
把这当作一个测试,到目前为止一切似乎都清楚了。我只是想知道如何以堆叠的方式绘制这 9 个条形图中的每一个,例如每个酒吧分为构成整个酒吧的 4 个部分。
基本上,我正在考虑以此处示例的方式执行此操作。
但是我想要 4 个,而不是 2 个堆栈。有什么想法可以从我现在的位置开始吗?每个提示都会非常感激。
谢谢!
编辑:如果我想为每个堆叠条实现给定值,例如:
...
z = [np.array([ 0.2, 0.6, 0.3, 0.6, 0.4, 0.3, 0.8, 0.5,  0.7]),
     np.array([ 0.8, 0.4, 0.5, 0.2, 0.8, 0.7, 0.4, 0.2,  0.9]),
     np.array([ 0.1, 0.2, 0.4, 0.4, 0.2, 0.6, 0.3, 0.6,  0.9]),
     np.array([ 0.9, 0.5, 0.7, 0.2, 0.5, 0.6, 0.7, 0.9,  0.7])]
dz = [z for i in range(4)]
...
这似乎不起作用,我不知道为什么?
Answers
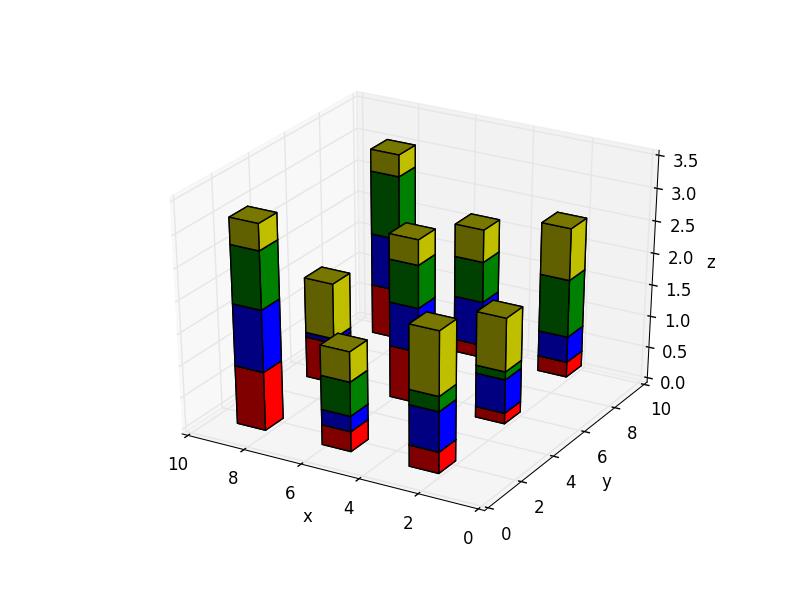
要制作堆叠的 3d 条形图,您可以累积dz值并将它们用作每个下一个条形的基础。这是一个例子:
from mpl_toolkits.mplot3d import Axes3D
import matplotlib.pyplot as plt
import numpy as np

fig = plt.figure()
ax = fig.add_subplot(111, projection = "3d")

ax.set_xlabel("x")
ax.set_ylabel("y")
ax.set_zlabel("z")
ax.set_xlim3d(0,10)
ax.set_ylim3d(0,10)

xpos = [2,5,8,2,5,8,2,5,8]
ypos = [1,1,1,5,5,5,9,9,9]
zpos = np.zeros(9)

dx = np.ones(9)
dy = np.ones(9)
dz = [np.random.random(9) for i in range(4)]  # the heights of the 4 bar sets

_zpos = zpos   # the starting zpos for each bar
colors = ['r', 'b', 'g', 'y']
for i in range(4):
    ax.bar3d(xpos, ypos, _zpos, dx, dy, dz[i], color=colors[i])
    _zpos += dz[i]    # add the height of each bar to know where to start the next

plt.gca().invert_xaxis()
plt.show()

Python社区为您提供最前沿的新闻资讯和知识内容
更多推荐

 0
0 0
0- 0


 已为社区贡献126445条内容

所有评论(0)