
devOps系列(六)grafana+prometheus搭建
作者目前打算分享一期关于devOps系列的文章,希望对热爱学习和探索的你有所帮助。文章主要记录一些简洁、高效的运维部署指令,旨在和能够。就像运维文档或者手册一样,方便进行系统的重建、改造和优化。每篇文章独立出来,可以单独作为其中一项组件的部署和使用。本章为。
前言
作者目前打算分享一期关于devOps系列的文章,希望对热爱学习和探索的你有所帮助。
文章主要记录一些简洁、高效的运维部署指令,旨在 记录和能够快速地构建系统。就像运维文档或者手册一样,方便进行系统的重建、改造和优化。每篇文章独立出来,可以单独作为其中一项组件的部署和使用。
本章为 devOps系列(六)grafana+prometheus搭建
大纲
devOps系列(六)grafana+prometheus搭建
devOps系列(七)grafana+prometheus监控告警
devOps系列(八)efk+prometheus+grafana日志监控和告警
正文
创建数据目录
export VOLUME_DIR=/data
mkdir -p ${VOLUME_DIR}/prometheus/{conf,data}
mkdir -p ${VOLUME_DIR}/alertmanager/{conf,data}
mkdir -p ${VOLUME_DIR}/grafana/data
mkdir -p ${VOLUME_DIR}/prometheus-alert/data
chmod o+w ${VOLUME_DIR}/prometheus/data
chmod o+w ${VOLUME_DIR}/prometheus-alert/data
chmod o+w ${VOLUME_DIR}/alertmanager/data
chmod g+w ${VOLUME_DIR}/grafana/data
安装docker-compose
curl -L "https://github.com/docker/compose/releases/download/1.24.1/docker-compose-$(uname -s)-$(uname -m)" -o /usr/local/bin/docker-compose
chmod +x /usr/local/bin/docker-compose
创建docker-compose.yml
cat > /data/docker-compose.yml << EOF
version: '3.7'

networks:
  default:
    driver: bridge

services:
  prometheus:
    image: prom/prometheus:v2.35.0-rc0
    container_name: prometheus
    hostname: prometheus
    ulimits:
      core: 0
    restart: always
    volumes:
      - /data/prometheus/conf:/etc/prometheus
      - /data/prometheus/data:/prometheus/data
    ports:
      - "9090:9090"
    command:
      - "--config.file=/etc/prometheus/prometheus.yml"
      - "--storage.tsdb.path=/prometheus/data"
      - "--web.enable-lifecycle"
    networks:
      - default

  alertmanager:
    image: prom/alertmanager:v0.24.0
    container_name: alertmanager
    hostname: alertmanager
    ulimits:
      core: 0
    restart: always
    volumes:
      - /data/alertmanager/conf:/etc/alertmanager
      - /data/alertmanager/data:/alertmanager/data
    ports:
      - "9093:9093"
    command:
      - "--config.file=/etc/alertmanager/alertmanager.yml"
    links:
      - prometheus-webhook-dingtalk:prometheus-webhook-dingtalk
      - prometheus-alert:prometheus-alert
    networks:
      - default

  grafana:
    image: grafana/grafana-oss:8.4.6
    container_name: grafana
    hostname: grafana
    ulimits:
      core: 0
    restart: always
    volumes:
      - /data/grafana/data:/var/lib/grafana
    ports:
      - "3000:3000"
    networks:
      - default


  prometheus-alert:
    image: feiyu563/prometheus-alert:latest
    container_name: prometheus-alert
    hostname: prometheus-alert
    restart: always
    volumes:
      - /data/alertmanager/app:/app
    ports:
      - "8080:8080"
    environment:
      - "PA_LOGIN_USER=prometheusalert"
      - "PA_LOGIN_PASSWORD=prometheusalert"
      - "PA_TITLE=PrometheusAlert"
      - "PA_OPEN_FEISHU=1"
      - "PA_OPEN_DINGDING=1"
      - "PA_OPEN_WEIXIN=1"
    networks:
      - default
EOF
创建配置文件
cat > /data/prometheus/conf/prometheus.yml << EOF
global:
  scrape_interval:     15s # Set the scrape interval to every 15 seconds. Default is every 1 minute.
  evaluation_interval: 15s # Evaluate rules every 15 seconds. The default is every 1 minute.
  scrape_timeout: 10s

alerting:
  alertmanagers:
  - timeout: 10s
    static_configs:
    - targets:
       - alertmanager:9093

rule_files:
   - "host_rules.yml"

scrape_configs:
  - job_name: '开发环境'
    scrape_interval: 10s
    static_configs:
    - targets:
      - '10.30.50.239:9100'
EOF
以上就是可以对于一些服务器的指标监控,主要是使用node-exporter镜像进行数据暴露和prometheus采集数据,形成grafana的图形化展示。
添加每台服务器的监控数据(这里都是基于docker的 很简单)
docker run -d \
  --restart always \
  --name node-exporter \
  --net="host" \
  --pid="host" \
  -v "/:/host:ro,rslave" \
  prom/node-exporter-linux-amd64 \
  --path.rootfs=/host \
  --collector.filesystem.ignored-mount-points "^/(sys|proc|dev|host|etc)($|/)"
这样就占用了9100端口,来供prometheus收集服务器数据信息。
创建alertamanger的配置文件
cat > /data/alertmanager/conf/alertmanager.yml << EOF
global:
  resolve_timeout: 15s

templates:
  - 'template/*.tmpl'

route:
  receiver: 'dingtalk' # 必须指定一个默认的receiver
  group_wait: 10s
  group_interval: 10s
  repeat_interval: 1h # 发送告警后间隔多久再次发送
  group_by: ['xxxProject']

receivers:
- name: 'email'
  email_configs:
  - to: 'admin@admin.com'
    from: 'm14704788879@163.com'
    smarthost: 'smtp.163.com:465'
    auth_username: 'm123@163.com'
    auth_password: '4sVQIHdiFRqRMgcc'
    require_tls: false
    html: '{{ template "email.html" . }}'
- name: 'wechat_app'
  wechat_configs:
  - send_resolved: false
    api_secret: 'petNZOEGxxxxx'
    api_url: 'https://qyapi.weixin.qq.com/cgi-bin/'
    corp_id: 'wx4b4bdsad123e'
    message: '{{ template "wechat.default.message" . }}'
    agent_id: '0'
    to_user: '@all'
    to_party: ''
    to_tag: ''
- name: 'wechat_webhook-prometheus-alert'
  webhook_configs:
  - url: 'http://prometheus-alert:8080/prometheusalert?type=wx&tpl=wechat_webhook-prometheus-alert&wxurl=https%3A//qyapi.weixin.qq.com/cgi-bin/webhook/send%3Fkey%3D51049573-2248-4ad5-98fc-eb0933f3a1d1'

inhibit_rules: # 定义一组告警的抑制规则,从而避免当某种问题告警产生之后用户接收到大量由此问题导致的一系列的其它告警通知
  - source_match:
      severity: 'critical'
    target_match:
      severity: 'warning'
    equal: ['alertname', 'dev', 'instance']
EOF
prometheusAlert全家桶有很多的通知方式,比如企业微信 机器人 邮件 钉钉等 很多方式,可以自行选择配置。
启动
cd /data
docker-compose up -d
访问
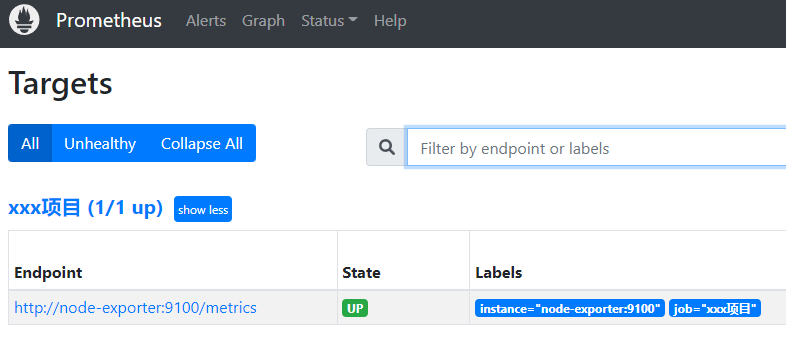
prometheus:http://ip:9090 ,访问:http://ip:9090/targets , 查看监控指标项

alertmanager:http://ip:9093 , 查看告警概览信息
grafana:http://ip:3000 ,默认帐号密码:admin admin , 图形化展示监控数据
建议:grafana可以做一下域名解析,如 grafana.jafir.top 到 nginx 转发到ip: 3000,来访问
grafana首次使用,需要先配置数据源。


键入url:http://prometheus:9090

添加dashboard

键入id:9276

为dashboard命名,并选择数据源

随后查看到监控数据

需要注意的是,默认情况下,该dashboard网卡流量图形没有数据,是因为实际网卡名称有变化导致,这里修改nic变量为实际网卡名称即可。
点击设置

变量 - 网卡
需要修改的地方

query_result(node_network_up{device="ens192"})
/device="(\S*)",instance/

等待几分钟,即可看到网卡流量图形就有了流量数据。
告警
告警规则
vi /data/prometheus/conf/host_rules.yml
groups:
- name: 'host'
  rules:
  - alert: '磁盘空间使用率告警'
    expr: ceil((1-(node_filesystem_avail_bytes{fstype=~"ext4|xfs"} / node_filesystem_size_bytes{fstype=~"ext4|xfs"})) * 100) >= 80
    for: 30s # 表示只有当触发条件持续一段时间后才发送告警。在等待期间新产生告警的状态为pending。
    annotations:
      description: "主机 {{ $labels.instance }} 磁盘使用率超过80%,挂载点:{{$labels.mountpoint}},目前使用率:{{ humanize $value  }}%"

  - alert: '主机连通性告警'
    expr: up == 0
    for: 65s
    annotations:
      description: "主机 {{ $labels.instance }} 网络连通性探测失败!"

  - alert: '系统平均负载过高告警'
    #expr: (node_load1 >= 1.50) or (node_load5 >= 1.50) or (node_load15 >= 1.50)
    expr: sum(node_load5) by (instance) > 10
    for: 60s
    annotations:
      description: "主机 {{ $labels.instance }} 系统平均负载过高,目前为:{{ humanize $value }}"

  - alert: '系统CPU使用率过高告警'
    expr: (1-((sum(increase(node_cpu_seconds_total{mode="idle"}[5m])) by (instance))/ (sum(increase(node_cpu_seconds_total[5m])) by (instance))))*100 > 80
    for: 60s
    annotations:
      description: "主机 {{ $labels.instance }} 5分钟内CPU使用率超过80%,目前为:{{ humanize $value }}%"

  - alert: '系统内存使用率过高告警'
    expr: (1-((node_memory_Buffers_bytes + node_memory_Cached_bytes + node_memory_MemFree_bytes)/node_memory_MemTotal_bytes))*100 > 80
    for: 60s
    annotations:
      description: "主机 {{ $labels.instance }} 内存使用率超过80%,目前为:{{ humanize $value }}%"

  - alert: '磁盘IO负载过高告警'
    expr: ((sum(increase(node_cpu_seconds_total{mode="iowait"}[5m])) by (instance))/(sum(increase(node_cpu_seconds_total[5m])) by (instance)))*100 > 10
    for: 60s
    annotations:
      description: "主机 {{ $labels.instance }} 磁盘IO过高,目前为:{{ humanize $value }}"

  - alert: '外网入口流量过高告警'
    expr: sum by (instance, device) (rate(node_network_receive_bytes_total{device=~"ens224"}[2m])) / 1024 / 1024 / 8 > 60
    for: 5m
    annotations:
      description: "主机 {{ $labels.instance }} 外网入口流量超过60Mbps带宽,目前为:{{ humanize $value }}Mbps"
重载配置生效
curl -XPOST http://localhost:9090/-/reload
告警通知
开源项目Prometheus Alert堪称告警全家桶,支持主流的监控系统Prometheus、Zabbix,日志系统Graylog2,Graylog3、数据可视化系统Grafana、SonarQube。阿里云-云监控,以及所有支持WebHook接口的系统发出的预警消息,支持将收到的这些消息发送到钉钉,微信,email,飞书,腾讯短信,腾讯电话,阿里云短信,阿里云电话,华为短信,百度云短信,容联云电话,七陌短信,七陌语音,TeleGram,百度Hi(如流)等。详情参考:https://github.com/feiyu563/PrometheusAlert
邮件
alertmanager默认内置告警邮件通知功能,只需要配置相关参数即可。但实际场景中由于邮件通知方式的即时性与可阅读性较差,所以一般并不采用此方式。
企业微信机器人webhook (目前我们主要使用这种方式)
浏览器访问:http://ip:8080 ,使用用户名密码登录 prometheusalert/prometheusalert ,点击AlertTemplate菜单来增加模板。
模板名称:wechat_webhook-prometheus-alert
模板类型:企业微信
模板用途:WebHook
模板内容:
{{range $k, $v := .alerts}}{{if eq $v.status "resolved"}}
## [Prometheus恢复]()
###### 告警类型: {{$v.labels.alertname}}
###### 故障主机: {{$v.labels.instance}}
###### 环境类型:{{$v.labels.job}}
###### 告警详情: {{$v.annotations.description}}
###### 故障时间:{{GetCSTtime $v.startsAt}}
###### 恢复时间:{{GetCSTtime $v.endsAt}}{{else}}
## [Prometheus告警]()
###### 告警类型: {{$v.labels.alertname}}
###### 故障主机: {{$v.labels.instance}}
###### 环境类型:{{$v.labels.job}}
###### 告警详情: {{$v.annotations.description}}
###### 故障时间:{{GetCSTtime $v.startsAt}}{{end}}
{{end}}
修改配置文件 vi /data/alertmanager/conf/alertmanager.yml
- name: 'wechat_webhook-prometheus-alert'
  webhook_configs:
  - url: 'http://prometheus-alert:8080/prometheusalert?type=wx&tpl=模板名称&wxurl=微信机器人webhook地址经URL编码'
重启一下配置:
docker restart alertmanager

一起探索未来云端世界的核心,云原生技术专区带您领略创新、高效和可扩展的云计算解决方案,引领您在数字化时代的成功之路。
更多推荐


 22
22 0
0- 0


 已为社区贡献3条内容

所有评论(0)