
Radeon GPU Profiler的Events Windows用法(二)
目录
Filtering wavefronts wavefront过滤器
Instruction Timing Capture Granularity 指令时序Capture 的粒度
Availability of Instruction Timing 指令时序数据的可用性
Instruction Timing Side Panel // Instruction Timing 子窗口
Pipeline state
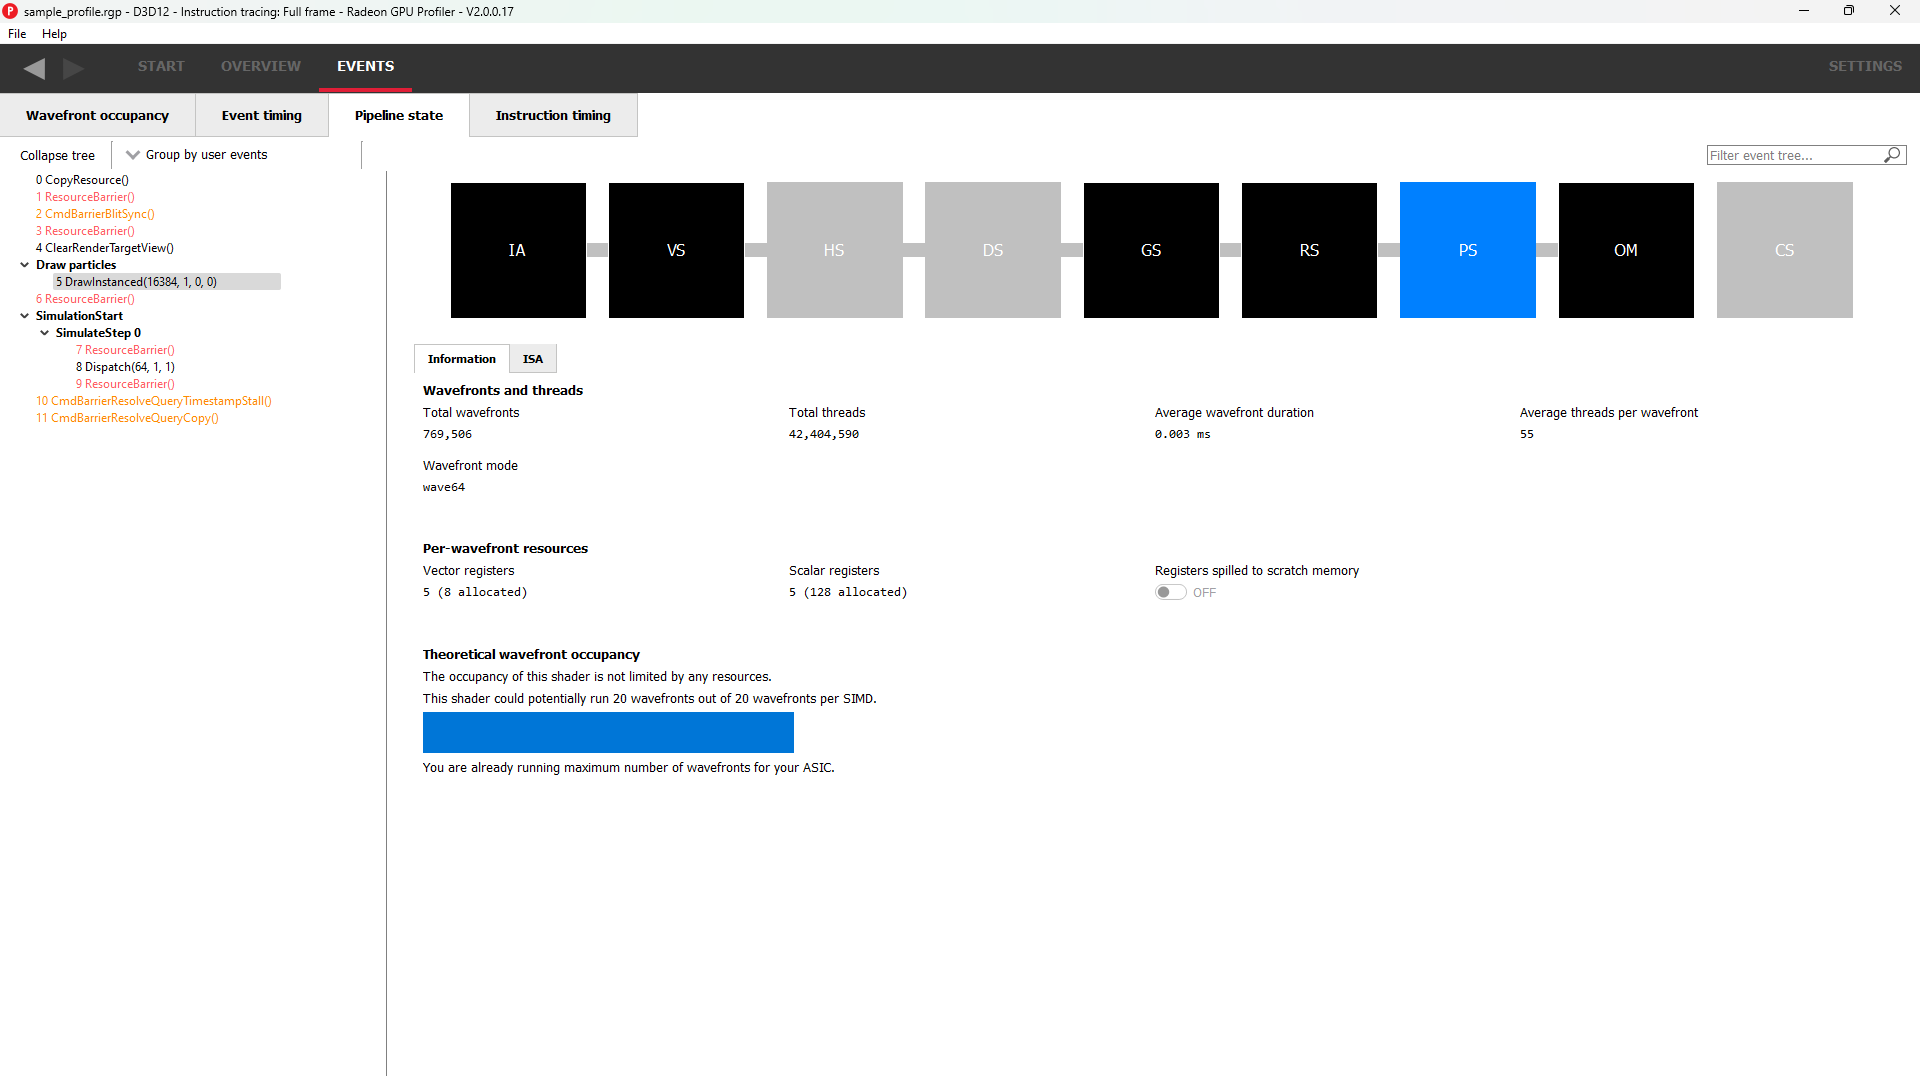
The pipeline state window shows the render state information for individual events by stage. In the example below the event is a DirectX12 DrawInstanced call using a VS, GS, and a PS. Active stages are rendered in black and can be selected, grey stages are inactive on this draw and cannot be selected.
The user has selected the PS stage for viewing and it is rendered in blue to indicate this. Below is a tabbed display to allow switching between a summary of the wavefront activity for this draw and the per-wavefront register resources used by the shader, and the shader ISA disassembly.
The register values indicate the number of registers that the shader is using. The value in parentheses is the number of registers that have been allocated for the shader.
From this information and knowledge about the RDNA or GCN architecture we can calculate the theoretical maximum wavefront occupancy for the pixel shader. In this case the maximum of 8 wavefronts per SIMD are theoretically possible, but may be limited by other factors.
pipeline state 窗口显示了按阶段划分的单个事件的渲染状态信息。在下面的示例中,该事件是一个使用 VS、GS 和 PS 的 DirectX12 DrawInstanced 调用。active 阶段显示以黑色,可以被选中;非active显示为灰色,无法被选中。
图里用户已选择 PS 阶段进行查看,所以PS阶段显示的蓝色。下面是一个选项卡,用来切换两种显示模式,一种是这个draw里的wavefront活动概况,另一个是着色器使用的每个wavefront的寄存器资源以及着色器 ISA 反汇编。
寄存器值显示的是着色器正在使用的寄存器数量。括号内的值是为着色器分配的寄存器数量。
根据这些Information窗口和对 RDNA 或 GCN 架构的了解,我们可以计算出像素着色器的理论最大wavefront occupancy。在图里这种情况下,每个 SIMD 理论上可以达到最多 8 个wavefront,但可能会受到其他因素的限制。
Switching to the ISA tab will show the shader code at the ISA level. At the top, some general information will be given, such as the number of registers used and allocated and the various hash values for this event.
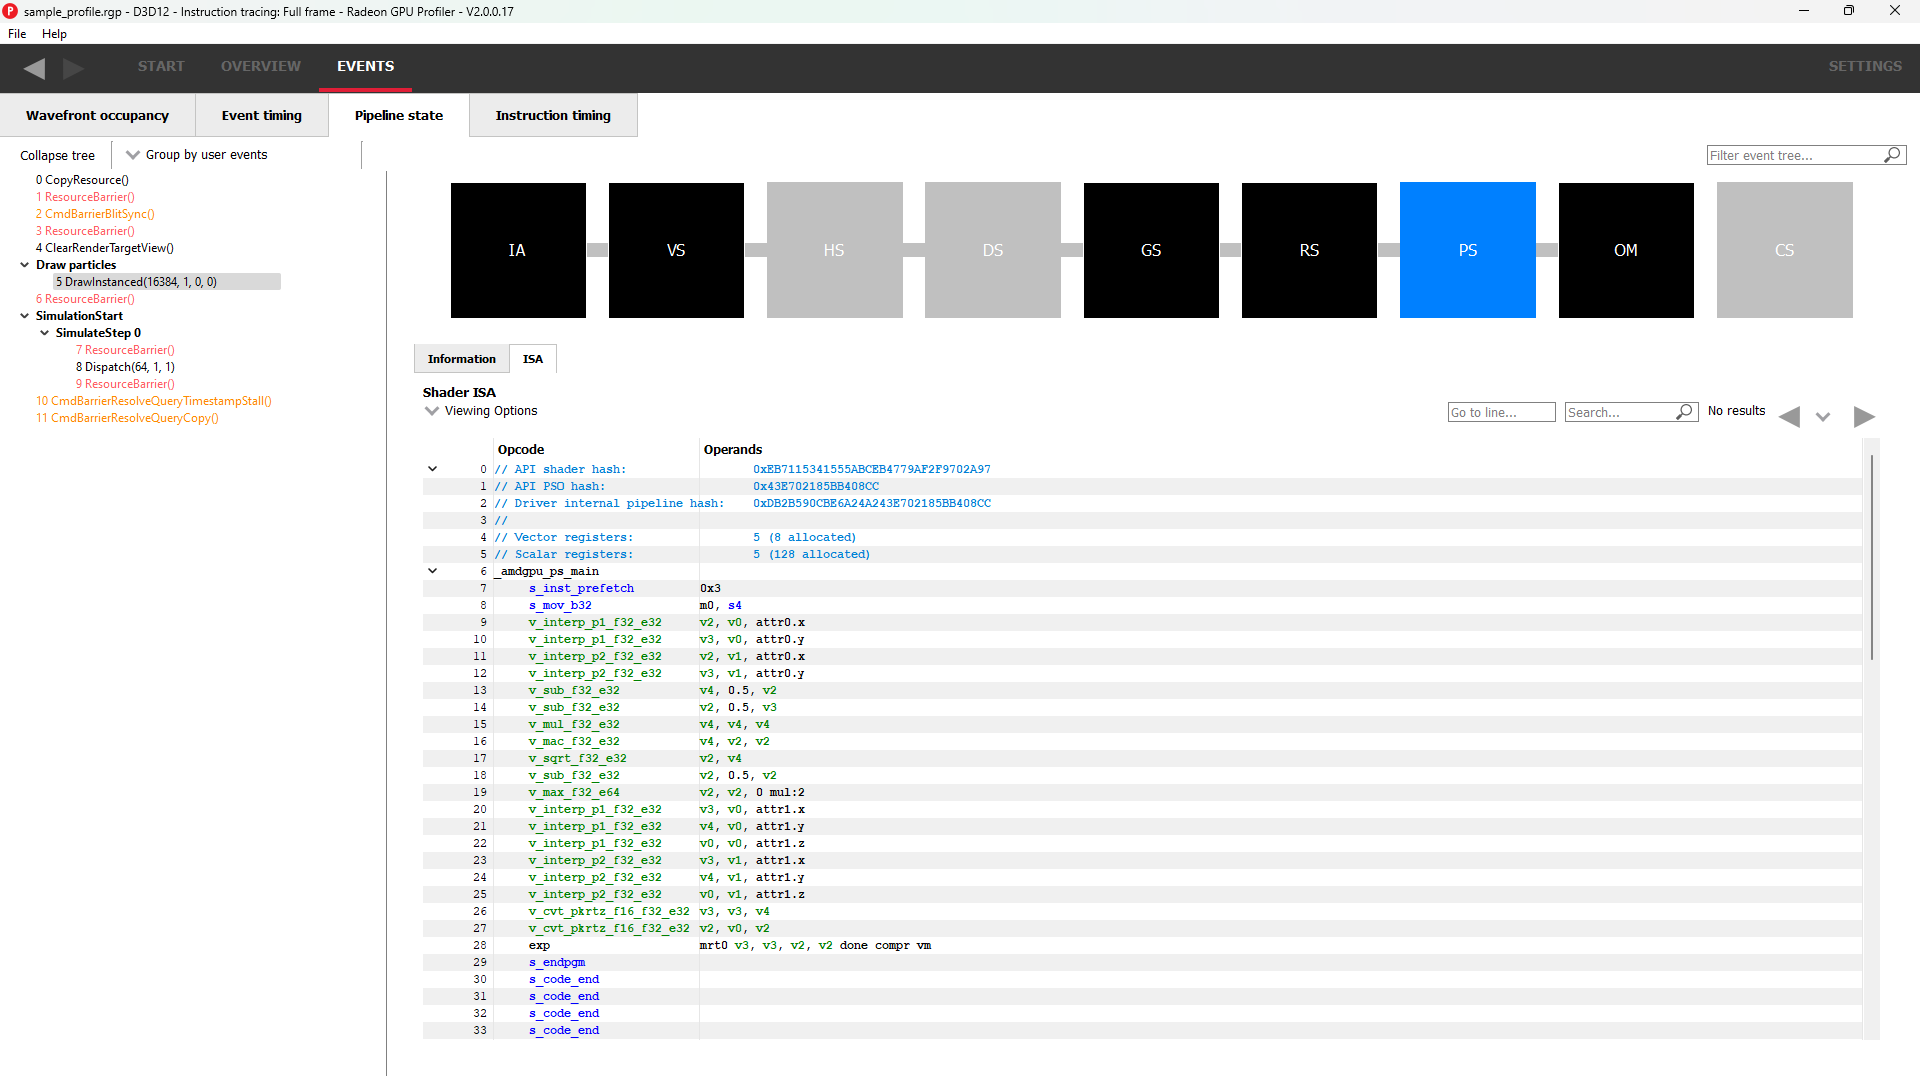
More information on the ISA tab can be found under the ISA View section.
Grouping modes
The grouping modes are the same as in the Event timing pane.
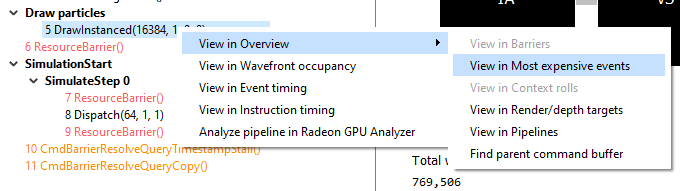
The user can also right-click on any of the events and navigate to the Wavefront occupancy or Event timing panes, as well as the Barriers, Most expensive events, Context rolls, Render/depth targets, and Pipelines panes within the Overview tab. The user can view the selected event in these panes, as well as in the side panels. Below is a screenshot of what the right-click context menu looks like.
分组模式与事件时序窗格中的相同。
用户还可以右键单击任何事件,导航到 Wavefront occupancy 或Event timing窗格,以及Overview 选项卡中的 Barriers, Most expensive events, Context rolls, Render/depth targets 和 Pipelines panes 。用户可以在这些窗格以及侧边栏中查看所选事件。下面是右键上下文菜单的截图。
Note: The Output Merger stage of a DirectX 12 application may report the LogicOp as D3D12_LOGIC_OP_COPY, even though it is set in an application as D3D12_LOGIC_OP_NOOP. These 2 operations are semantically the same if blending is enabled. A no-op indicates that no transform of the data is to be performed so the output is the same as the source.
Note: For OpenCL or HIP applications, the pipeline state does not show the graphics specific stages since they are not active during compute dispatches.
Note: DirectX 12 应用程序的输出合并阶段可能将 LogicOp 报告为 D3D12_LOGIC_OP_COPY,即使在应用程序中设置为 D3D12_LOGIC_OP_NOOP。如果启用了混合,这两个操作在语义上是相同的。无操作(no-op)表示不对数据进行任何变换,因此输出与源相同。
Note: 对于 OpenCL 或 HIP 应用程序,Pipeline State 不显示图形特定阶段,因为这些阶段在计算调度期间不active 。
Raytracing events
For raytracing events, there are two possible compilation modes: Unified and Indirect. The AMD driver and compiler will choose the mode for each raytracing event. The compilation mode chosen for a particular event will be evident in the event name: events which use the Unified mode will have a <Unified> suffix, while events which use the Indirect mode will have an <Indirect> suffix. In the case of DirectX Raytracing, the full event names are DispatchRays<Unified> or ExecuteIndirect<Rays><Unified> and DispatchRays<Indirect> or ExecuteIndirect<Rays><Indirect>. For Vulkan, the full event names are vkCmdTraceRaysKHR<Unified> or vkCmdTraceRaysIndirectKHR<Unified> and vkCmdTraceRaysKHR<Indirect> or vkCmdTraceRaysIndirectKHR<Indirect>. The main difference between these two compilation modes has to do with how the individual shaders in the raytracing pipeline are compiled. In Unified mode, the individual shaders are inlined into a single shader, resulting in a single set of ISA. In Indirect mode, the individual shaders are compiled separately, and the functions in each shader end up as their own set of ISA instructions. Function call instructions are generated in the ISA to allow one function to call another. For the indirect mode, the overall occupancy of the event is affected by the resource usage of all shaders, even those that have a zero call count. Even if the shader function that uses the highest number of vector registers is not actually executed, the fact that it uses the most registers means that it could be the reason for lower overall occupancy for the event.
When selecting a raytracing event that uses the indirect compilation mode, the Pipeline state pane will look a bit different.
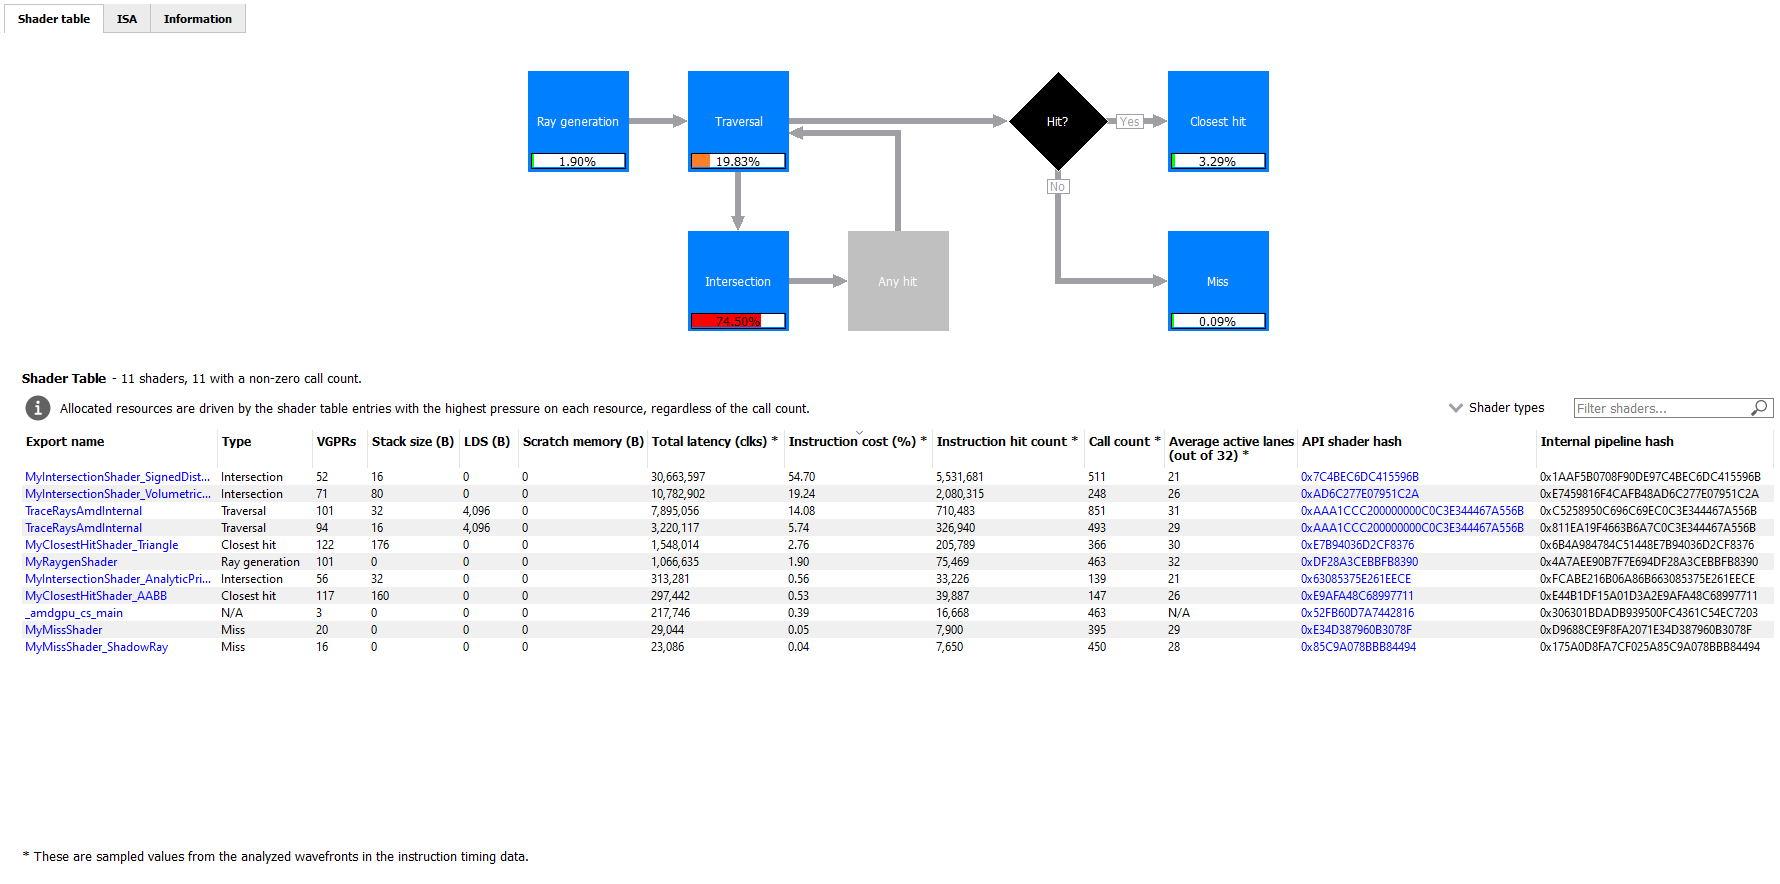
There are three tabs available: Shader table, ISA, and Information.
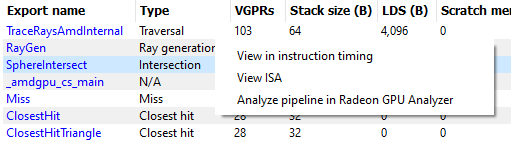
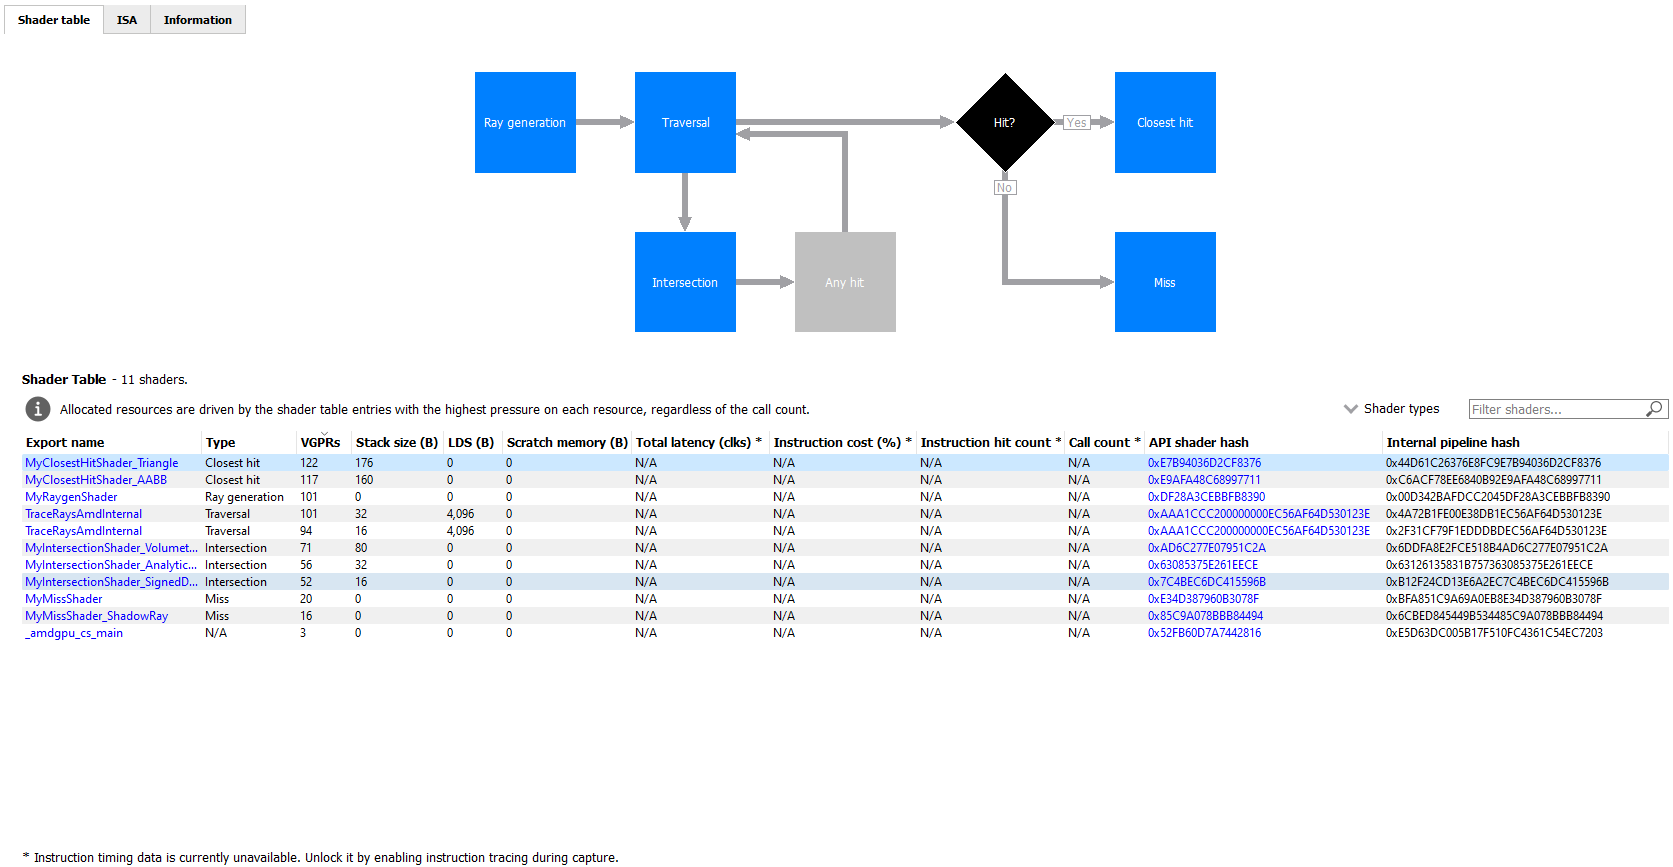
The Shader table tab contains two main parts: an interactive flowchart representing the raytracing pipeline and a table containing the list of shader functions. Each shader function has an associated type. This type can be Ray generation, Traversal, Intersection, Any hit, Closest hit, Miss or Callable. The shader table lists each shader function, its type, resource usage statistics, instruction timing statistics, and both the API shader hash and the Internal pipeline hash. You can filter the table by shader type using the Shader types combo box. You can also filter the table by Export name using the Filter shaders… field. If you click on any hyperlinked text in the shader table, it will navigate to the ISA tab and show the ISA for the selected shader function. You can also use the right-click context menu to navigate to either the ISA tab or to the Instruction timing view. The context menu also allows you to analyze the pipeline binary for that shader function in the Radeon GPU Analyzer.
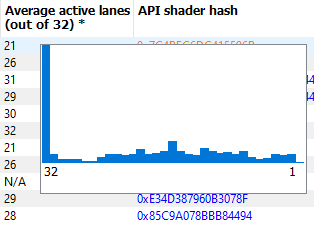
If the Enable shader instrumentation checkbox was checked in Radeon Developer Panel when the profile was captured, the table will also include a column showing the number of average active lanes for each shader function, across all calls made to the function. The number of active lanes is sampled near the beginning of execution for each shader, giving an indication of the amount of thread divergence in the entire raytracing pipeline. When hovering the mouse over a cell in this column, a tooltip will be displayed to show the distribution of the number of active lanes for individual calls. This can give an indication of how many different execution paths through the pipeline were taken at runtime. Please note that enabling this setting in the Radeon Developer Panel may cause additional runtime overhead for the application that is being profiled.
The flowchart gives a visual representation of the raytracing pipeline, as well as shows the relative percent cost of the shader functions in each stage. The percentage bars are color-coded as follows: Red indicates that a stage contains shaders that represent over 50% of the total cost for the event. Orange indicates that a stage contains shaders whose total cost is in the range of 10% to 50%, and green indicates that a stage’s total cost is less than 10%.
The flowchart also provides a quick way to filter the shader table. When a stage is clicked, the table will only show shader functions from that stage. You can filter more than one stage by holding down the CTRL key and clicking additional stages. Selected stages are shown as blue, unselected stages are shown as black, and disabled stages (stages with no corresponding shader functions) are shown as grey. You can remove all filters by clicking in any whitespace area in the flowchart.
Both the table and the flowchart will contain a full set of data for profiles captured with Instruction tracing enabled. For profiles captured without Instruction tracing, several columns in the table will show N/A instead of actual data. Similarly, the flowchart will not show the percent bars for profiles captured without Instruction tracing enabled.
The following screenshot shows how this view will look when Instruction timing data is not available.
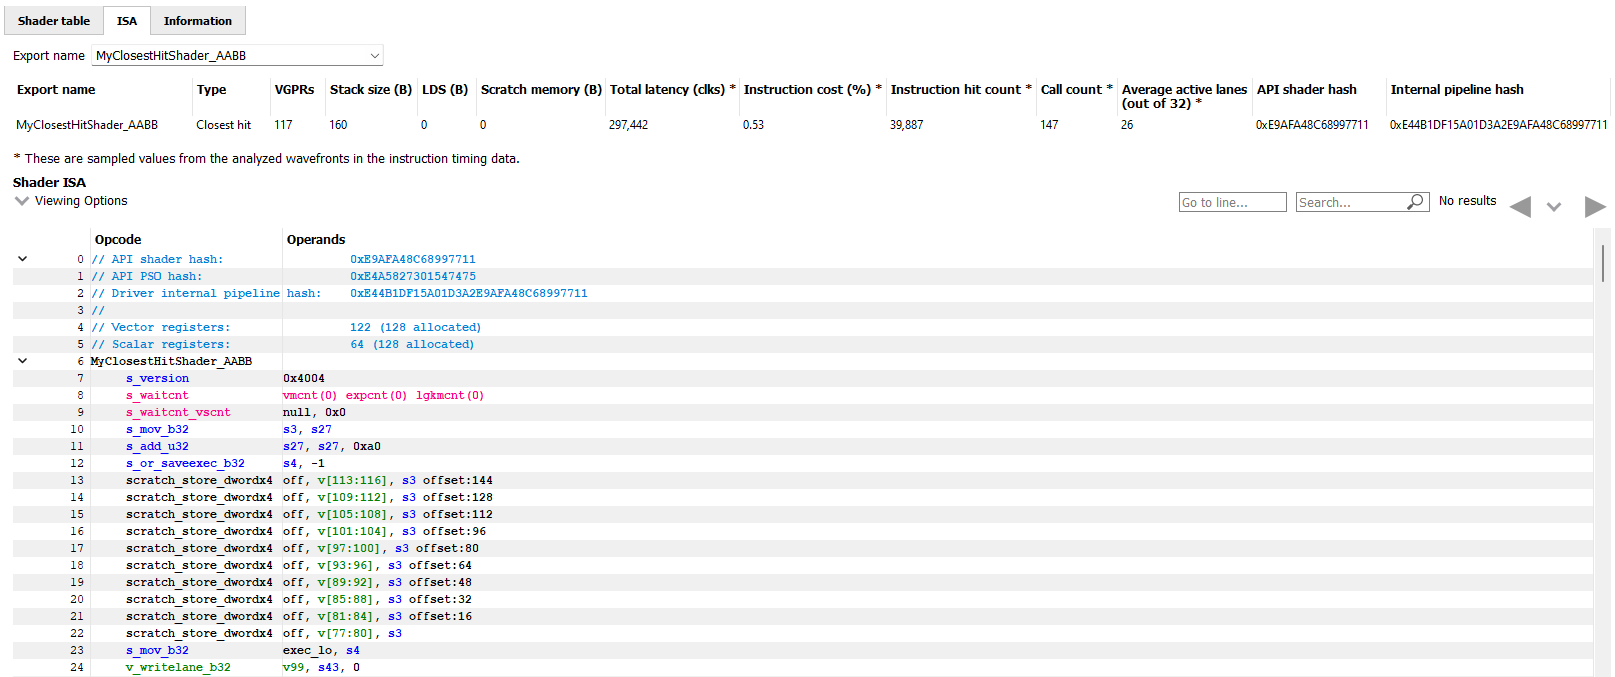
The ISA tab will also look different for raytracing events that use the indirect compilation mode. In addition to the normal ISA listing, there is also a drop down combo box that allows for viewing the ISA from a different shader function. For the selected shader function, the corresponding row from the shader table is also displayed for reference.
Instruction timing/指令时序
The Instruction timing pane shows the average issue latency of each instruction of a single shader. The instruction timing information is generated using hardware support on AMD RDNA and GCN GPUs. Generating instruction timing does not require recompilation of shaders or insertion of any instrumentation into shaders. The Instruction timing pane shows RDNA or GCN ISA. For more details on the ISA, please refer the following resources:
The AMD GPU ISA Documentation on GPUOpen. These guides provide detailed definitions of the instructions you may see in RGP.
The User Guide for AMDGPU Backend as part of the LLVM User Guides. This guide provides details on some minor differences you may see in the Instruction timing pane versus what you might read in the ISA guides on GPUOpen. For instance some VALU instructions may appear with an extra suffix to provide more information on the instruction encoding. These suffixes, which are added by the LLVM-based AMDGPU disassembler, are described here.
Instruction timing,指令时序窗格展示了某个着色器的每一条指令的平均latency(延迟)。Instruction timing的信息是通过AMD RDNA和GCN GPU的硬件支持生成的,这个过程不需要重新编译着色器或在着色器中插入任何检测工具。Instruction timing 窗格显示的是RDNA或GCN指令集架构(ISA)。有关ISA的更多详细信息,请参考以下资源:
- GPUOpen上的AMD GPU ISA Documentation 。这个指南提供了在RGP中可能看到的指令的详细定义。
- 作为LLVM用户指南一部分的User Guide for AMDGPU Backend 。该指南提供了一些您可能在指令时序窗格中看到的与GPUOpen的ISA指南相比的细微差异。例如,一些VALU指令可能会带有额外的后缀,以提供有关指令编码的更多信息。这些后缀是由基于LLVM的AMDGPU反汇编器添加的,在这里进行了描述。
The Instruction timing pane for a shader is shown below.
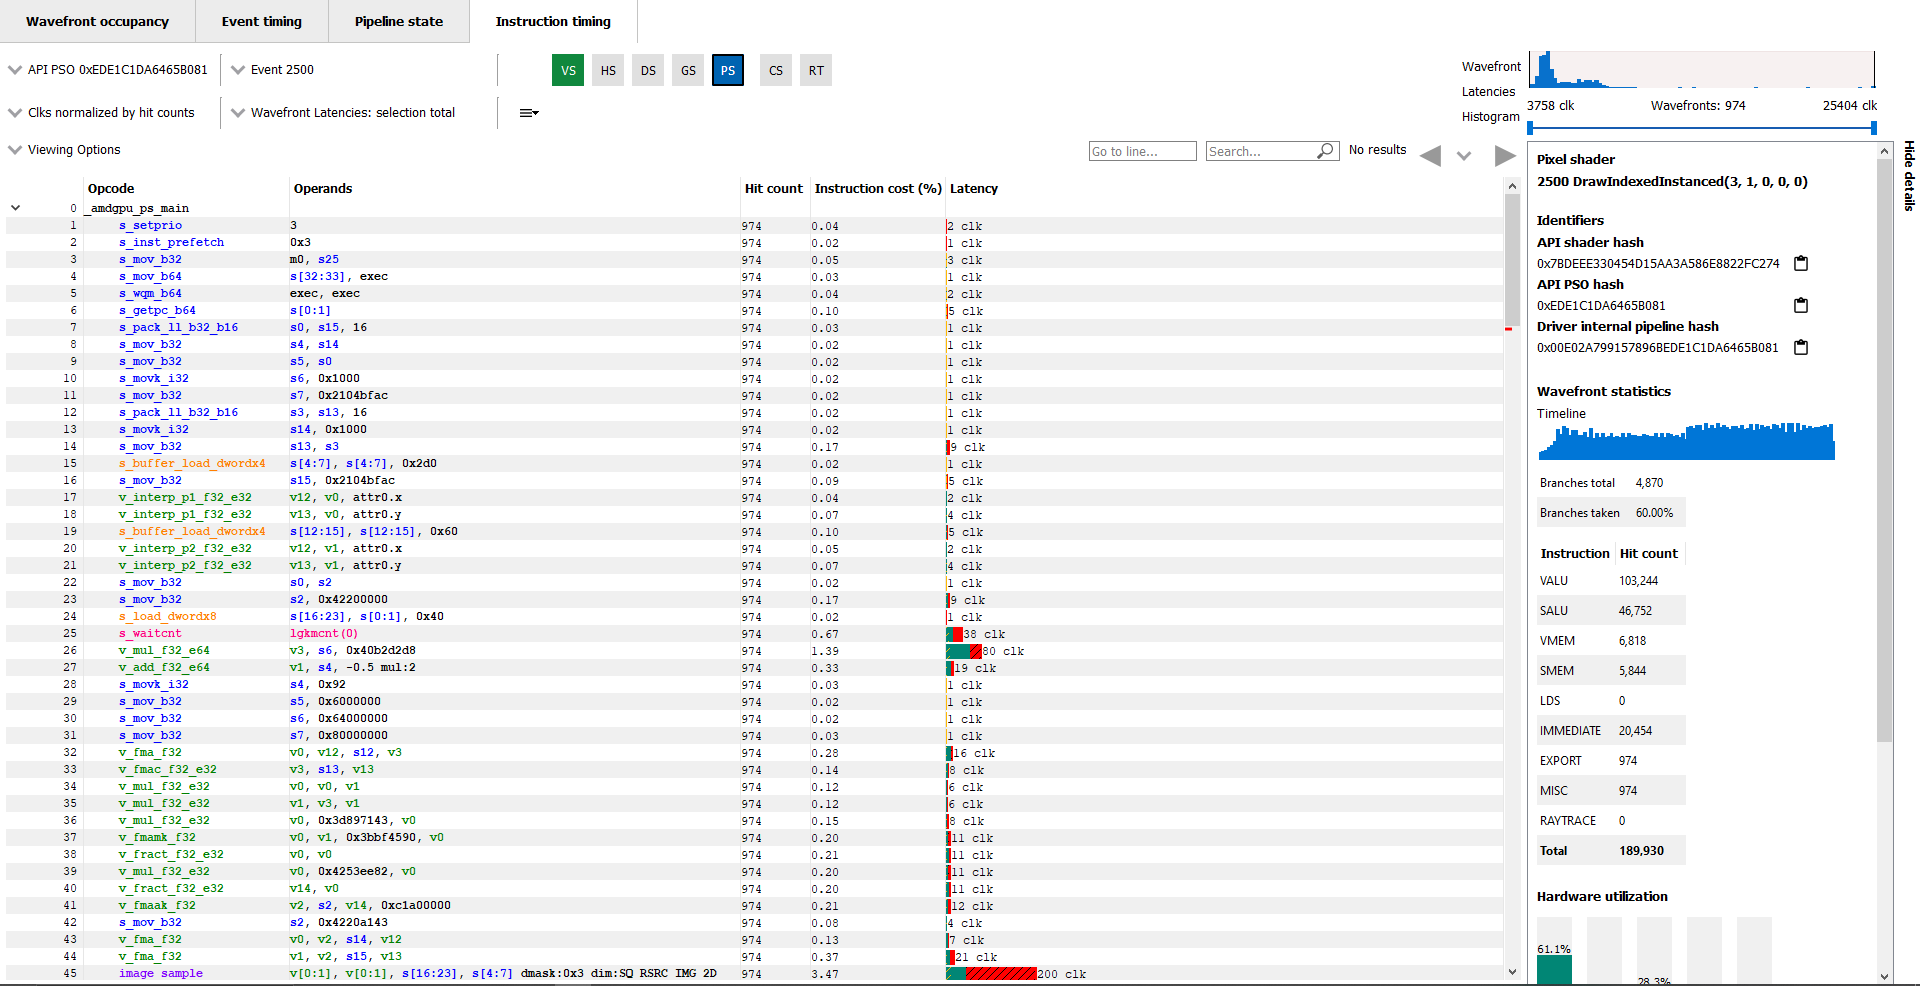
Latency
Each shader line in the Instruction timing view shows the time taken between the issue of an instruction and the one after that. To provide information on what Latency means some sample ISA statements are shown below.
Instruction timing中shader的每一行,都会显示了这一行的指令所消耗的时间。为了说明Latency是什么意思,下面举例了一些不同的ISA模式。
Best Case Instruction Issue: In the below image, we see five instructions. The 1 clk denotes the latency between the issue of each of the instructions and the issue of the following instruction. This example shows an ideal performance case where each instruction is issued at an interval of 1 clock.
最理想的情况:在下图中,我们看到五条指令。1个时钟周期(clk)表示每条指令发出与下一条指令发出之间的延迟。这个例子展示了一个理想的性能情况,其中每条指令以1个时钟周期的间隔发出。

Delays in Instruction Issue: In the below image, we see four export instructions. The first exp instruction has a rather long interval of 4,162 clocks. This can be expected since the export instruction’s issue can be delayed for reasons such as unavailable memory resources which may be in use by other wavefronts. As a result, there is a long duration in the instruction. Since the latency waiting for memory resources was seen for the first export instruction, the subsequent exports, have a much shorter duration.
有延迟的指令: 在下图中,我们看到四条export指令。第一条导出指令(exp)有一个相对较长的间隔,达到4,162个时钟周期。这是合理的,因为export指令发出后,可能会因内存资源不可用而发生latency,这些资源可能正被其他 wavefront 使用。因此,该指令的 duration 较长。由于第一条export指令在等待内存资源时出现延迟,后续的export指令有了更短的 duration (这里,有一种解释是,第一条 export 指令在执行时需要访问内存资源,但这些资源可能被其他wavefront占用,导致了较长的延迟。一旦第一条指令完成并释放了这些资源,后续的 export 指令便可以更快地访问它们)。

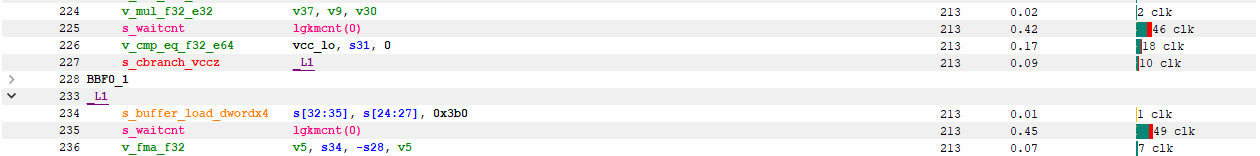
Waitcounts and Instruction Issue: In the below image, we see seven instructions. There are two scalar buffer loads and three scalar ALU instructions, all of which issue with little latency. We then see a s_waitcnt instruction. The s_waitcnt has a longer issue interval of 2,088 clocks. The short latencies of the previous s_buffer_load_dword instructions may seem counter intuitive since those are memory load instructions. However, this is expected as s_waitcnt is a shader instruction used for synchronization to wait for previous instructions, such as the previous buffer loads, to finish. The s_waitcnt instruction will issue and then wait (in this case 2,088 clocks) until the next instruction which is the v_add_f32_e64 can be issued.
等待计数与指令发出:在下图中,我们看到七条指令。有两条scalar buffer(标量缓冲区)加载指令和scalar ALU(三条标量算术逻辑单元)指令,所有这些指令的发出延迟都很小。接下来看`s_waitcnt`指令。`s_waitcnt`的发出间隔较长,为2,088个时钟周期。为什么`s_buffer_load_dword`作为内存加载指令用时这么短看起来有点奇怪,但是结合`s_waitcnt`看就合理了。`s_waitcnt`则是一个用于同步的着色器指令,在这里用于等待前面的指令(缓冲区加载指令)完成。`s_waitcnt`指令将被发出,然后等待(在图里的例子中是2,088个时钟周期),直到下一个指令`v_add_f32_e64`可以被发出。
(笔记:因为`s_buffer_load_dword`的发出仅表示将指令送入内存子系统队列,耗时可以很短,但实际从内存(显存或缓存)中读取数据需要数百甚至数千个时钟周期。如果后续指令依赖加载的数据(如`v_add_f32_e64`),就必须等待加载完成才能执行,否则会产生错误结果。`s_waitcnt`是GPU提供的同步指令,用于确保内存加载(存储、ALU操作同理)完成后再继续执行后续指令。 这个例子里,在`s_buffer_load_dword`和`s_waitcnt`之间插入不依赖加载结果的独立指令,可以充分利用GPU的并行能力,减少`s_waitcnt`导致的空闲周期。 )

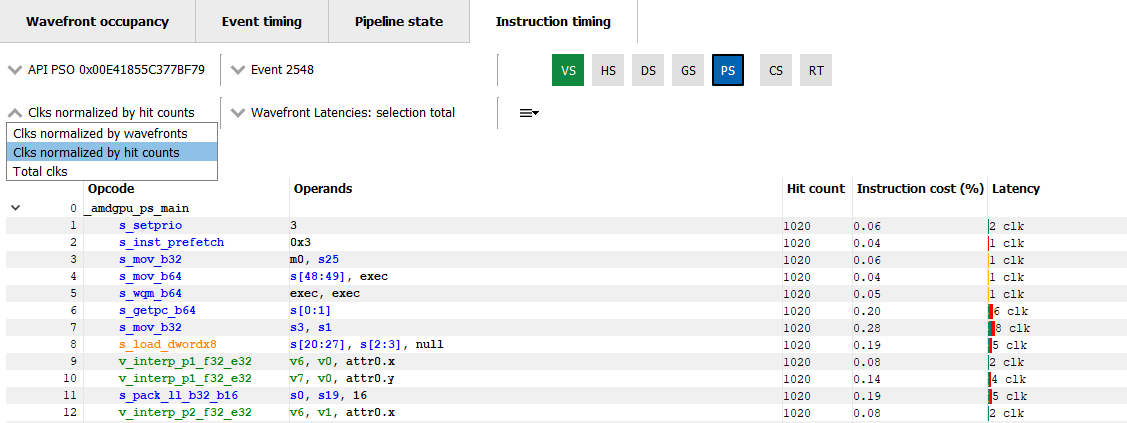
By default, the Latency between any two instructions is an average of the latency measured per hit for that instruction. The latency can also be displayed as an average per wavefront or as a total across all wavefronts. This can be toggled using the normalization mode drop down shown below.
默认情况下,任意两条指令之间的Latency是基于该指令的每次命中测量的平均延迟。延迟还可以显示为每个 wavefront 的平均值或所有 wavefront 的总值。这可以通过下方显示的“Clks normalized by…”下拉菜单进行切换。
The number of clock cycles shown for a given instruction is also represented by a bar. The length of the bar corresponds to the number of clock cycles worth of latency for an instruction. Different colors are used in the bars to indicate which parts of an instruction’s latency were hidden by work performed on other wave slots while the subsequent instruction was waiting to be issued on its slot. This can be seen in the image below.
指令对应的时钟周期数也是用条形图表示。条形的长度对应于指令的延迟时钟周期数。条形中使用不同的颜色来指示在后续指令等待发出时,其他wave slots上执行的工作隐藏了指令延迟的哪些部分。这可以在下图中看到。
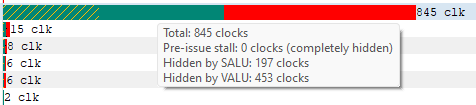
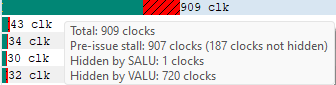
Solid green indicates how much of a given instruction’s latency was hidden by VALU work. Solid yellow indicates how much latency was hidden by SALU or SMEM work. A diagonal hatch pattern made up of both green and yellow indicates how much latency was hidden by both VALU and SALU work. Sections with a black diagonal hatch pattern are the portion of the stall that is the pre-issue stall. Finally, solid red indicates how much latency was not hidden by other work being done on the GPU. It is likely that bars with large red segments indicate a stall occurring while the shader is executing. When the mouse hovers over a row in the Latency column, a tooltip appears showing the exact breakdown of that instruction’s latency.
In the image above, the total latency of the instruction is 845 clocks. Of those 845 clocks, 197 clocks worth of latency are hidden by SALU work on other slots and 453 clocks worth of latency are hidden by VALU work. The 197 clocks where both SALU and VALU work was being done is shown using the hatch pattern. The segment between 197 and 453 clocks is shown as green since only VALU work is being done. The segment between 453 and 845 clocks is shown as red since there is no other work being done. Since there is more VALU work being done at the same time, green is more prevalent than yellow in this bar.
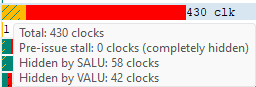
Contrast this with the image below, where an instruction is shown where more latency is hidden by SALU work. In this case, yellow is more prevalent than green.
实心绿色表示给定指令的延迟中有多少是被算术逻辑单元(VALU)工作隐藏的。实心黄色表示有多少延迟是被SALU(标量算术逻辑单元)或SMEM(共享内存)工作隐藏的。由绿色和黄色组成的对角线阴影图案表示有多少延迟是同时被VALU和SALU工作隐藏的。带有黑色对角线阴影图案的部分是预发出停滞的部分。最后,实心红色表示有多少延迟没有被GPU上执行的其他工作隐藏。通常,具有较大红色部分的条形可能表示着色器执行期间发生了停滞。当鼠标悬停在延迟列中的一行时,会出现工具提示,显示该指令延迟的确切细分。
在上面的图中,该指令的总延迟为845个时钟周期。在这845个时钟周期中,197个时钟周期的延迟被其他slots 上的SALU工作隐藏,453个时钟周期的延迟被VALU工作隐藏。197个时钟周期的SALU和VALU工作使用阴影图案表示。197和453个时钟周期之间的部分显示为绿色,因为只有VALU工作在进行。453和845个时钟周期之间的部分显示为红色,因为没有其他工作在进行。由于同时进行的VALU工作更多,因此在这个条形中,绿色部分比黄色部分更为明显。
与下图对比,这里显示的指令的延迟被SALU工作隐藏得更多。在这种情况下,黄色部分比绿色部分更为明显。
When the amount of latency hidden by SALU and VALU work is greater than the the pre-issue stall, no black diagonal hatch pattern will be displayed, and the tooltip will display that the pre-issue stall is completely hidden. If the amount of latency hidden by SALU and VALU work is less than the pre-issue stall, the duration after the VALU and SALU work will have the black diagonal hatch pattern, as shown in the image below.
如果SALU和VALU类的工作隐藏的 latency 大于pre-issue stall时,就不会有黑色阴影,工具提示pre-issue stall 的latency完全被隐藏了。如果SALU和VALU工作隐藏的 latency 量小于 pre-issue stall ,那VALU和SALU工作后面的那段 duration 会有黑色阴影,如下图所示。
A red indicator will be shown in the vertical scroll bar corresponding to the location of the instruction with the highest latency. This allows you to quickly find the hotspot within the shader.
在垂直滚动条中,会看到一个红色指示器,指向具有最高延迟的指令的位置。这使您能够快速找到着色器中的热点。
|
“Pre-issue stall”指的是在指令发出之前,由于各种原因导致指令无法立即被发出的延迟。这种停滞通常会影响程序的执行效率,以下是对这个概念的详细理解: ### 1. 定义 - **Pre-issue stall** 是指在指令调度过程中,由于资源不可用、数据依赖性、硬件限制或其他因素,导致指令无法按预期立即发出。 ### 2. 原因 - **资源竞争**: 处理器的某些资源(如执行单元、寄存器或内存)可能正在被其他指令占用。 - **数据依赖性**: 某条指令可能依赖于前一条指令的结果,如果前一条指令尚未完成,该条指令就无法发出。 - **控制依赖**: 在分支指令中,后续指令可能需要等待分支决策的结果。 - **硬件限制**: 某些指令可能需要特定的硬件资源(如功能单元),如果这些资源不可用,则会导致停滞。 ### 3. 影响 - **性能下降**: Pre-issue stall 会导致指令流水线中的空闲周期,从而降低整体执行效率。 - **延迟增加**: 由于指令无法及时发出,整体程序的执行时间会增加。 ### 4. 优化方法 - **指令调度**: 通过重排指令的执行顺序,可以减少数据依赖造成的停滞。 - **增加并行性**: 利用更多的执行单元和资源,可以减少资源竞争导致的停滞。 - **静态和动态调度**: 使用编译器优化或动态调度技术,可以有效降低停滞的影响。 ### 总结 Pre-issue stall 是指在指令发出之前的延迟,是影响计算机性能的一个重要因素。理解和优化这种停滞对于提高程序的执行效率至关重要。 |
Hit Count
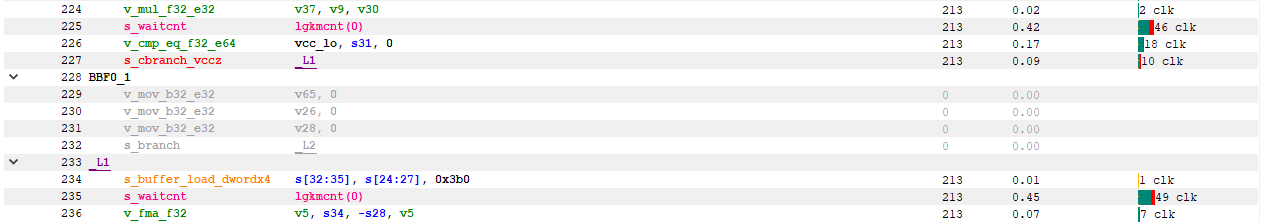
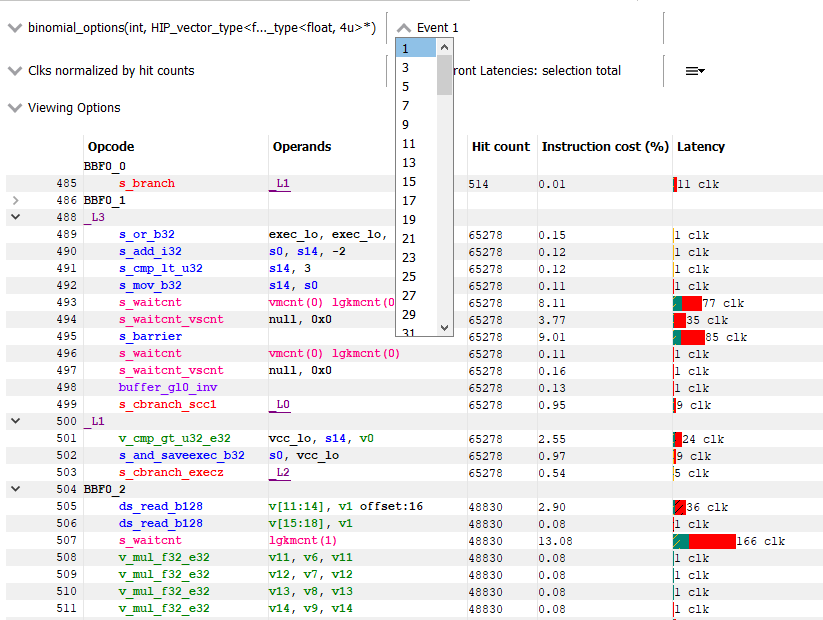
The Hit count for each instruction shows the number of times the instruction was executed for the selected event. Any basic blocks that have a hit count of zero across all wavefronts in a shader will automatically be collapsed when viewing an event for the first time, as shown below.
Hit count (每条指令的命中计数)显示了该指令在所选事件中被执行的次数。在着色器中,如果某个 block 完全没有被任何一个 wavefront 执行,会被自动折叠住,如下所示。
Basic blocks with a current hit count of zero based on the current latency range and latency selection mode will also be grayed out, as shown below.
基于当前延迟范围和延迟选择模式,Hit Count为零的 block 会显示为灰色,如下所示。
Instruction Cost Percent
The Instruction Cost for each ISA instruction shows the percentage of the Total Issue Latency of the whole shader. For shaders with branches where consecutive instructions can have varying hit counts, the Instruction Cost incorporates the extra hit counts for that instruction. This allows us to find the hot-spot in the shader.
The Instruction Cost for an ISA instruction is calculated as follows:
Instruction Cost = 100 * (Sum of All Latencies for ISA Instruction) / (Sum of All Latencies for the shader)
Filtering wavefronts wavefront过滤器
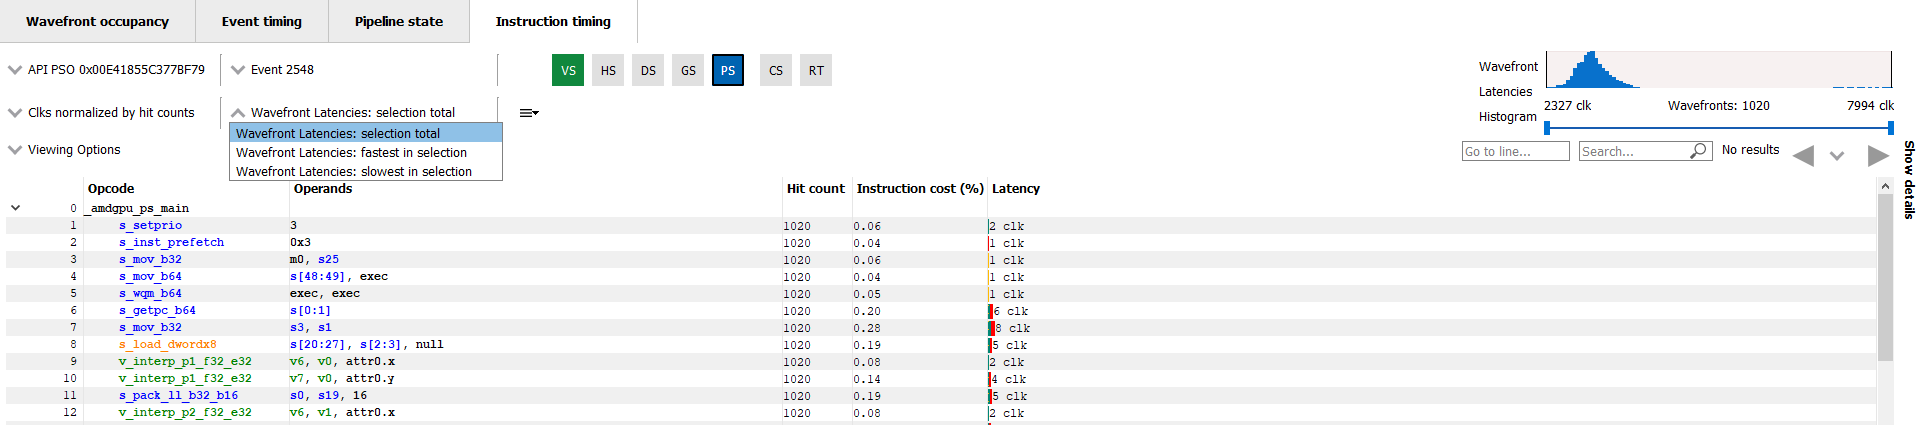
By default the Latency, Hit count and Instruction cost values are calculated using all wavefronts that have been analyzed for a given shader. Information about the fastest wavefront and the slowest wavefront can also be displayed, providing insight into any outliers in terms of performance. The Wavefront latencies drop down (shown below) can be used to toggle between showing all wavefronts, the fastest wavefront and the slowest wavefront.
默认情况下,Latency, Hit count and Instruction cost 的值是从给定着色器的所有wavefront计算得出的。也可以显示最快和最慢wavefront的信息,方便发现性能中的任何异常。Wavefront latencies下拉菜单(如下所示)可用来切换是显示所有wavefront、最快Wavefront还是最慢Wavefront。
It is also possible to filter which wavefronts are analyzed using the Wavefront Latencies Histogram (shown below).
还可以使用Wavefront Latencies Histogram( wavefront 延迟直方图(如下所示))来过滤要看哪些wavefront。
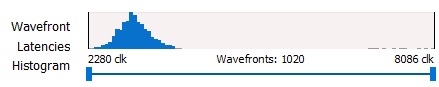
This histogram provides a visual representation of the full set of wavefronts for the current shader. The fastest wavefronts are on the left side of the histogram and the slowest wavefronts are on the right. Latency values increase moving from left to right. The height of each bar in the histogram gives a relative indication of how many wavefronts correspond to each set of latency values represented by the bars.
Below the histogram is a slider control that can be used to filter wavefronts. The two sliders allow you to specify a clock range for the wavefronts to analyze. Only wavefronts that fall into the specified range will contribute to the Latency, Hit count and Instruction cost percentage values displayed. If a range is set, the fastest in selection and slowest in selection filters will show information from the fastest and slowest waves within that range.
If all analyzed wavefronts have the same total latency, the histogram will be hidden, as all wavefronts would end up in a single bucket. Because of this, the histogram is hidden when there is only a single wavefront analyzed for the selected shader. Any time the histogram is hidden, the Wavefront latencies drop down and the Timeline in the Wavefront statistics section of the side panel will also be hidden.
这个直方图展示了当前着色器的所有 wavefront。这个图左侧是耗时最短的wavefront,右侧耗时最长的wavefront。Latency值从左到右递增。直方图中每个条形的高度相对指示了与每组Latency值对应的wavefront数量。
在直方图下方有一个滑块控制,可以用来过滤wavefront,通过两个滑块可以指定要分析的wavefront的clk范围。只有落入指定范围内的wavefront才会对显示的Latency, Hit count and Instruction cost percentage 值产生影响。如果设置了范围,则“fastest in selection”和“slowest in selection”过滤器将显示该范围内耗时最长和最短的wavefront的信息。
如果所有的wavefront具有相同的总latency,直方图将被隐藏,因为所有wavefront都在同一个桶(直方图的一个柱子)中。因此,当选定的着色器只有一个wavefront被分析时,直方图将被隐藏。每当直方图被隐藏时,Wavefront latencies下拉菜单和侧边栏的 Wavefront statistics 统计信息中的时间线也将被隐藏。
Instruction Timing Capture Granularity 指令时序Capture 的粒度
Instruction timing information is generated for the whole RGP profile, but data is limited to a single shader engine. Only waves executed by a single shader engine contribute to the hit counts and timing information shown in the Instruction timing pane. Please see the Radeon Developer Panel documentation for more information on how to capture instruction timing information.
To view all the events that have instruction timing information, the developer can choose the “Color by instruction timing” option in the Wavefront occupancy or the Event timing views.
Instruction timing 信息是为整个 RGP 配置文件生成的,但数据仅限于单个shader engine(着色器引擎)。Instruction timing 面板中显示的hit counts 和 timing information的数据只会来自同一个shader engine 执行的waves会对。更多有关如何capture Instruction timing信息的信息,请参考 Radeon Developer Panel。
要查看所有具有Instruction timing的事件,可以 Wavefront occupancy 或 Event timing 视图中选择“Color by instruction timing”选项。
Availability of Instruction Timing 指令时序数据的可用性
In certain cases it is possible that the instruction timing information may not be available for all events. The main reasons why instruction timing information may not be present for an event are described below.
Hardware Architecture and Draw Scheduling: Instruction timing information is only sampled from some of the compute units on a single shader engine of the GPU. As a result, it is possible for events with very few waves to not have instruction data. This can happen if the GPU schedules the waves on a shader engine or compute unit that doesn’t have instruction trace enabled.
Internal Events: It should be noted that it is not possible to view instruction timing information for internal events such as Clear().
有些event是没有instruction timing信息的,缺少instruction timing信息的情况主要有以下这些:
硬件架构与绘制调度:instruction timing信息是从GPU中一个shader engine的部分compute unit中采样的。所以对于那些用到很少的wavefront的事件,就有可能没有instruction timing数据。比如说GPU 刚好将wavefront分配到了到一个没有启用instruction timing功能的shader engine或compute unit中,就会发生没有instruction timing被统计到的情况。
内部事件:对于内部事件(例如函数 Clear()),无法获取instruction timing信息。
Navigation
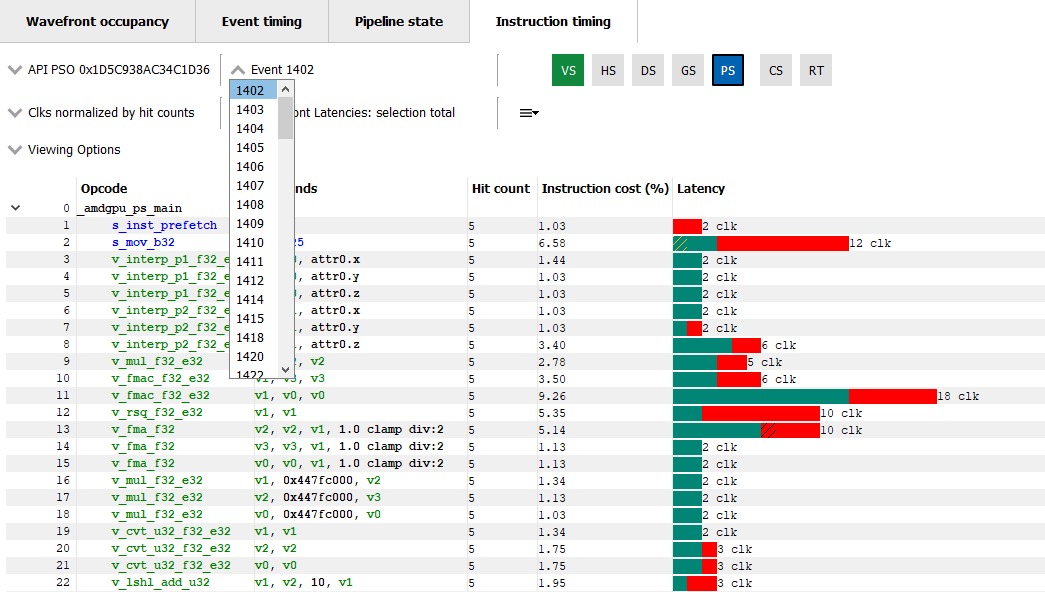
The instruction timing for an event can be accessed by right clicking on that event and choosing the “View In Instruction timing” option. Since it is common to use the same shader in multiple events, RGP provides an easy way to toggle between multiple events that use the same shader using the event drop down shown below.
This allows the developer to study the behavior of the shader for different events. It is recommended to use the keyboard shortcuts, (Shift + Up and Shift + Down) to change the API PSO selection and (Shift + Left and Shift + Right) to move across different events using the same shader. The API Shader Stage Control indicates which shader stages are active for the selected event. When an active stage is clicked, the Instruction timing pane will update to show the timing data for the selected shader stage.
右键单击一个事件并选择“View In Instruction timing”选项,可以直接访问到这个事件的 instruction timing。由于多个事件常常使用相同的着色器,RGP 提供了一种简单的方法,可以在使用一个着色器的多个事件之间切换,如图所示的事件下拉菜单。
这个菜单方便我们研究同个着色器不同事件中的表现。建议使用键盘快捷键,`Shift + Up` 和 `Shift + Down` 来更改 API PSO 选择,`Shift + Left` 和 `Shift + Right` 来在使用相同着色器的不同事件之间移动。API Shader Stage Control 指示选定事件的活动着色器阶段。当点击一个活动阶段时,指令时序面板将更新以显示所选着色器阶段的时序数据。
Navigation of Raytracing events// 光线追踪事件的导航
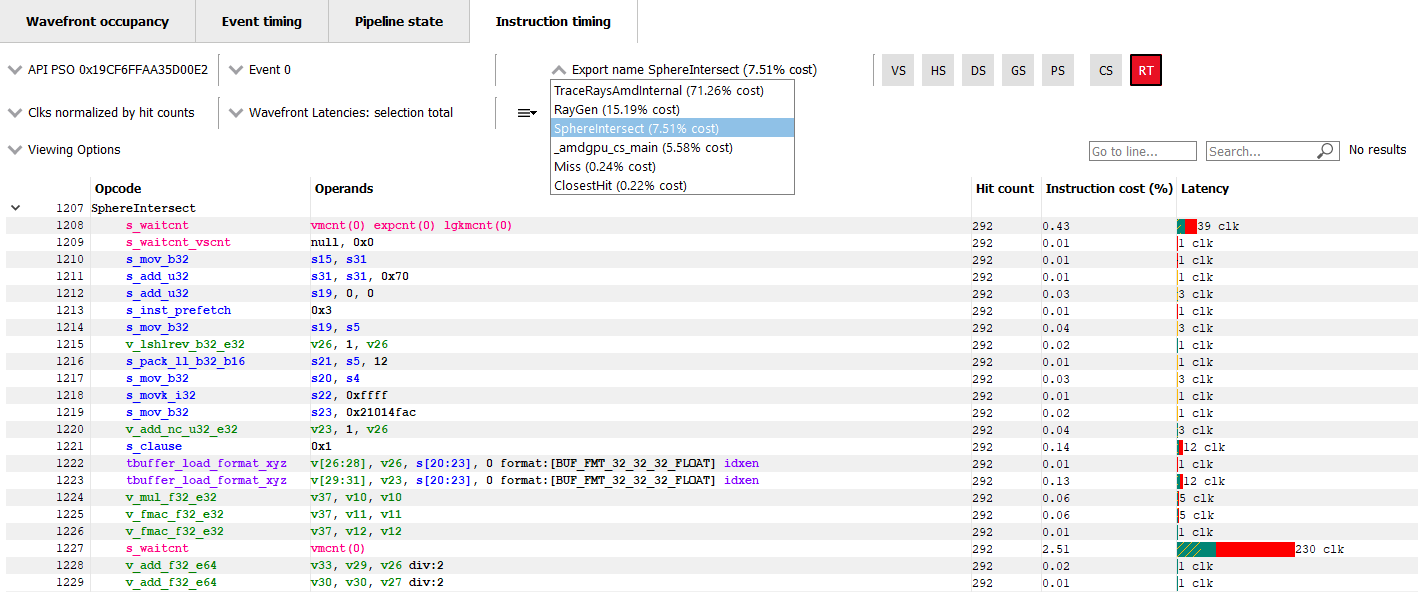
For certain Raytracing events, an additional Export name drop down will be available. Whether or not this drop down is shown depends on the compilation mode chosen by the AMD driver and compiler for the selected event. There are two possible compilation modes: Unified and Indirect. The compilation mode chosen for a particular event will be evident in the event name: events which use the Unified mode will have a <Unified> suffix, while events which use the Indirect mode will have an <Indirect> suffix. In the case of DirectX Raytracing, the full event names are DispatchRays<Unified> or ExecuteIndirect<Rays><Unified> and DispatchRays<Indirect> or ExecuteIndirect<Rays><Indirect>. For Vulkan, the full event names are vkCmdTraceRaysKHR<Unified> or vkCmdTraceRaysIndirectKHR<Unified> and vkCmdTraceRaysKHR<Indirect> or vkCmdTraceRaysIndirectKHR<Indirect>. The main difference between these two compilation modes has to do with how the individual shaders in the raytracing pipeline are compiled. In Unified mode, the individual shaders are inlined into a single shader, resulting in a single set of ISA. In Indirect mode, the individual shaders are compiled separately, and the functions in each shader end up as their own set of ISA instructions. Function call instructions are generated in the ISA to allow one function to call another.
The way the ISA code is presented in the Instruction timing view follows the way the driver and compiler handle the shaders. For Unified mode, there is a single stream of ISA and the Instruction timing view treats it as a single shader. For Indirect mode, there are multiple streams of instructions, one for each shader in the raytracing pipeline. The instruction streams and their associated costs are displayed per-shader and appear one after the other in the Instruction timing view. Only shader functions with non-zero cost are displayed in the Instruction timing view. Shaders with zero cost can still be viewed in the Pipeline state pane.
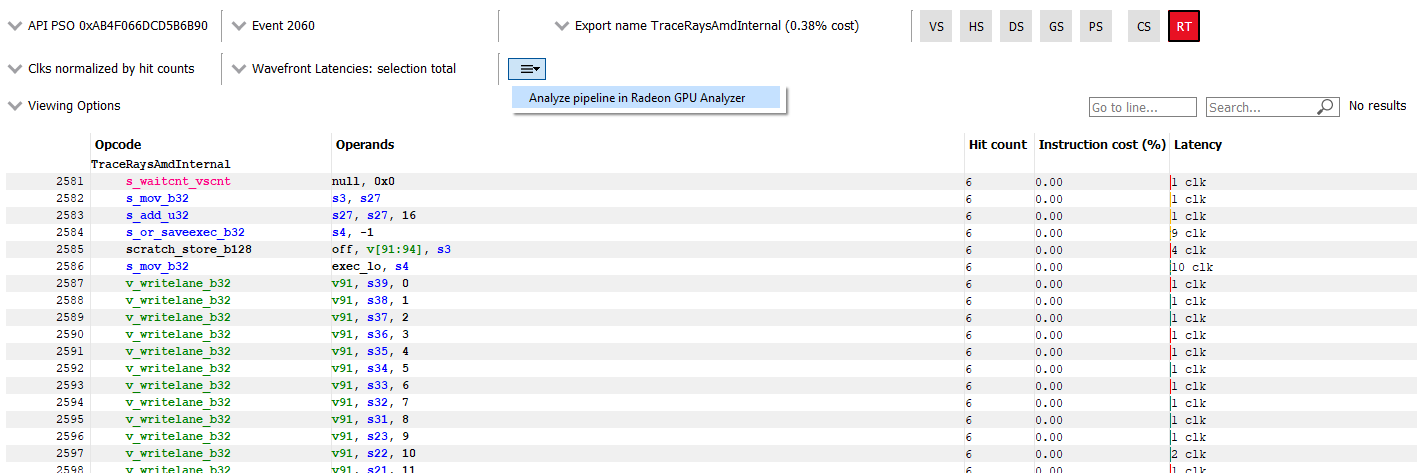
To help with navigation among the various shader functions, the Export name drop down is available for any events that use the indirect compilation mode. This drop down allows the developer to toggle between the multiple shaders. The drop down contains the list of exports along with their Instruction cost. The exports will be sorted by the Instruction cost. Ctrl + Shift + Up and Ctrl + Shift + Down can be used to move among the list of Export names. This Export name drop down is shown below.
对于某些光线追踪事件,可能会提供额外的导出名称下拉菜单。是否显示此下拉菜单取决于 AMD 驱动程序和编译器为选定事件选择的编译模式。可能的编译模式有两种:统一模式和间接模式。特定事件所选的编译模式将在事件名称中明显显示:使用统一模式的事件将带有 `<Unified>` 后缀,而使用间接模式的事件将带有 `<Indirect>` 后缀。在 DirectX 光线追踪的情况下,完整的事件名称为 DispatchRays<Unified> 或 ExecuteIndirect<Rays><Unified> 和 DispatchRays<Indirect> 或 ExecuteIndirect<Rays><Indirect>。对于 Vulkan,完整的事件名称为 vkCmdTraceRaysKHR<Unified> 或 vkCmdTraceRaysIndirectKHR<Unified>,以及 vkCmdTraceRaysKHR<Indirect> 或 vkCmdTraceRaysIndirectKHR<Indirect>。这两种编译模式的主要区别在于光线追踪管线中的各个着色器是如何编译的。在统一模式下,单个着色器内联为一个,生成一组 ISA。在间接模式下,各个着色器单独编译,每个着色器中的函数最终成为自己的 ISA 指令集。ISA 中生成函数调用指令,以允许一个函数调用另一个函数。
指令时序视图中的 ISA 代码呈现方式遵循驱动程序和编译器对着色器的处理。在统一模式下,有一条 ISA 流,指令时序视图将其视为单个着色器。在间接模式下,有多条指令流,每条流对应光线追踪管线中的一个着色器。每个着色器的指令流及其相关成本在指令时序视图中逐个显示。只有具有非零成本的着色器函数会在指令时序视图中显示。成本为零的着色器仍可在管道状态面板中查看。
为了帮助在各种着色器函数之间导航,对于使用间接编译模式的任何事件,都会提供导出名称下拉菜单。该下拉菜单允许开发者在多个着色器之间切换。下拉菜单中包含导出列表及其指令成本,导出按指令成本排序。可以使用 `Ctrl + Shift + Up` 和 `Ctrl + Shift + Down` 在导出名称列表中移动。
Navigation in Compute profiles
In profiles collected for OpenCL or HIP applications, the navigation controls are slightly different. Instead of the API PSO drop down, there is a event name/kernel name drop down. This drop down contains an entry for each unique kernel dispatch found in the profile. Once an event name or kernel name is selected, the Event drop down can be used to choose between events that dispatch the selected kernel. The API Shader Stage Control is not available in Compute profiles. Keyboard shortcuts can be used to cycle through the available kernel names (Shift + Up and Shift + Down) and to move across different events using the selected kernel (Shift + Left and Shift + Right). The navigation controls for a Compute profile are shown below.
The pipeline binary of an event can also be exported for analysis in the Radeon GPU Aanalyzer from the instruction timing pane. Select the hamburger drop down as shown in the image below and select “Analyze pipeline in Radeon GPU Analyzer”. Selecting this option for indirect raytracing events will save and open the pipeline binary for the currently selected export name.
More information on some of the features available in the Instruction timing pane can be found under the ISA View section.
Instruction Timing Side Panel // Instruction Timing 子窗口
The Instruction timing side panel provides additional information about the shader shown.
Instruction Timing 子窗口提供了关于当前显示的着色器的一些额外信息。
The main sections in the side panel are:
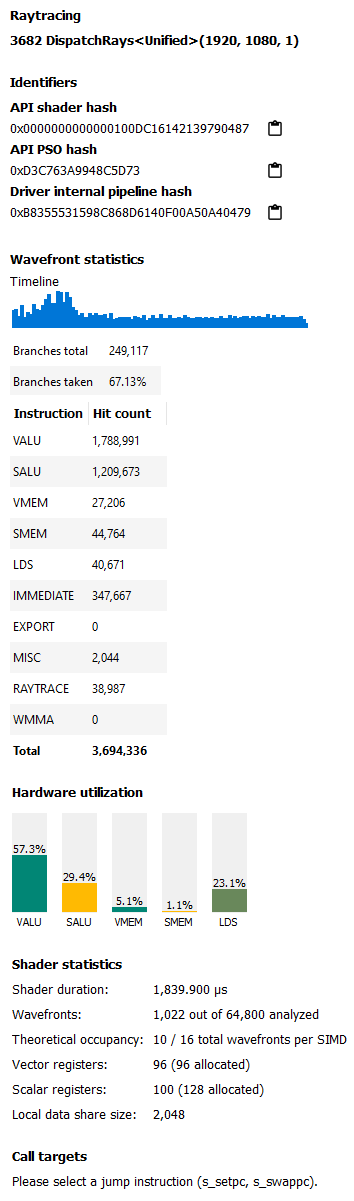
Identifiers: This section includes multiple hashes that can be used to identify the shaders used and the pipeline that they are a part of.
Wavefront Statistics: The wavefront statistics provide information about the selected range of wavefronts. As such, the information displayed depends on both the selected mode in the Wavefront latencies drop down as well as the range selected in the Wavefront Latencies Histogram.
The Timeline provides a visual representation of when the selected wavefronts were executed. When the Histogram is used to limit the range of wavefronts, the Timeline is updated such that waves that do not fall within the specified range are displayed as grey. Only waves that fall within the range are displayed as blue. This allows you to see where particular waves were executed. For instance, it might be expected that slower waves were executed early on if, for instance, memory caches were not yet warm. Using the Timeline in conjunction with the Histogram can help determine where a bottleneck might be.
The Branches table denotes the number of branch instructions in the shader and the percentage of the total number of branches that were taken by the shader.
The Instruction Types table provides information about the dynamic instruction mix of the shader’s execution. The columns denote the different types of instructions supported by RDNA and GCN. The counts denote the number of instructions of each category.
侧边栏的主要部分包括:
标识(Identifiers):这部分包含多个哈希值,用于识别所使用的着色器及其所处的pipeline。
wavefront 统计(Wavefront Statistics):wavefront statistics提供有关所选wavefront 范围的信息。因此,显示的信息取决于Wavefront latencies下拉菜单中选定的模式以及在 Wavefront Latencies Histogram 中选择的范围。
时间轴(Timeline):时间轴展示的是wavefront是什么时候被执行的。并且,时间轴里的数据会随着Wavefront Latencies Histogram直方图范围的更新而更新,不在直方图指定范围内的wavefront 显示为灰色,在范围内的wavefront 显示为蓝色。这样就能看到特定wavefront 的执行位置。例如,如果内存缓存还没有预热完成*,可能会前期会是一些比较慢的wavefront(意思是随着程序的执行,越来越多的wavefront的执行会让GPU把一些常用的数据从主内存读取,存储到缓存里,这样后续wavefront的就不再需要去比较慢的主存读取数据,而是直接读缓存)。将时间轴与直方图结合使用可以帮助确定瓶颈在哪里。
分支表(Branches):分支表记录了着色器中分支指令的数量及其占总分支数的百分比。
指令类型表(Instruction Types):指令类型表提供有关着色器执行的动态指令组合的信息。列表示 RDNA 和 GCN 支持的不同类型的指令,计数表示每个类别的指令数量。 每个类别的计数表示在事件中该着色器调用的指令数量。同一着色器的不同执行可能会根据发射的wavefront数量和循环参数等因素具有不同的指令统计数据。指令类别在下文中进行了简要描述。有关更多详细信息,请参阅 AMD GPU ISA 文档。
Each category’s count denote the instruction count for that shader’s invocation in the event. Different executions of the same shader could have different Instruction statistics based on factors such as the number of wavefronts launched for the shader and loop parameters. The instruction categories are briefly described below. Please see the AMD GPU ISA Documentation for more details.
-
VALU: Includes vector ALU instructions
-
SALU: Includes scalar ALU instructions
-
VMEM: Includes vector memory and flat memory instructions
-
SMEM: Includes scalar memory instructions
-
LDS: Includes Local Data Share instructions
-
IMMEDIATE: Includes the immediate instructions such as s_nop and s_waitcnt
-
EXPORT: Includes export instructions
-
MISC: Includes other miscellaneous instructions such as s_endpgm
-
RAYTRACE: Includes the BVH instructions used during raytracing. Only shown when viewing profiles captured on a GPU that supports ray tracing
-
WMMA: Includes the WMMA instructions used during wave matrix multiply accumulate operations. Only shown when viewing profiles captured on a GPU that supports WMMA instructions
The instruction types table provides a useful summary of the shader’s structure especially for very long shaders.
Hardware Utilization: The Hardware utilization bar charts show the utilization of each functional unit of the GPU on a per-shader basis.
It should be noted that utilization shown is only for the shader being viewed. For example, in the image shown, the VALU utilization of the shader is 67.6%. This means that the Raytracing shader shown used 67.6% of the VALU capacity of the GPU. Other shaders may be concurrently executing on the GPU. Their usage of the VALU is not considered when showing the bar charts.
A functional unit’s utilization is calculated as follows:
Utilization % = 100 * (Hit Count of all instructions executed on the functional unit) / (Duration of analyzed wavefronts)
Shader Statistics: The shader statistics section provides useful information about the shader
-
Shader Duration: This denotes the execution duration of the whole shader. It can be correlated with the timings seen for the same shader in other RGP views such as the Wavefront occupancy and the Event timing views.
-
Wavefronts: This denotes the total number of wavefronts in the shader and the number of wavefronts analyzed as part of building the instruction timing visualizations. It is expected that not all waves in the shader will be analyzed. This is for the same reasons described above when discussing the availability of instruction timing.
-
Theoretical Occupancy: From the register information and knowledge about the GPU architecture we can calculate the theoretical maximum wavefront occupancy for the shader.
-
Vector and Scalar Registers: The register values indicate the number of registers that the shader is using. The value in parentheses is the number of registers that have been allocated for the shader.
-
Local Data Share Size: This value indicates how many bytes of local data share are used by the shader. This is only displayed for Compute Shaders.
Call Targets: While viewing data for a shader that calls other functions, a Call targets list is displayed in the side panel whenever a “s_swappc” or “s_setpc” instruction with a non-zero hit count is selected. In the ISA view, a glyph is displayed next to any such instruction. For a “s_swappc” instruction, the Call targets list shows the names of the exports that control may jump to, along with a hit count indicating how many times each target was called. For a “s_setpc” instruction, the Call targets list shows the name of the export that control will return to. This feature is currently supported for pipelines used by <Indirect> raytracing events as well as for HIP kernels that call additional functions in their execution.

Instruction Timing for RDNA
On RDNA GPUs, instruction timing can include certain instructions with a hit count of 0. Usually this will be an instruction called s_code_end and may also be present after the shader’s s_endpgm instruction. This is expected since this is an instruction added by the compiler to allow for instruction prefetching or for padding purposes. The hardware does not execute this instruction.
Such instructions may also be present in the ISA view in the Pipeline state pane.

免费领 200 小时云算力,进群参与显卡、AI PC 幸运抽奖
更多推荐
 3
3 0
0- 0


 已为社区贡献4条内容

所有评论(0)