Echarts how to highlight area between 2 line charts
·
Answer a question
I want to develop an echart that has the area between 2 linecharts highlighted in a color. To achieve this, I made use of stacked area chart. I set the color of the upper area as the highlight color and color of lower area as white so as to achieve my result. However, the color of bigger area is merging with the lower area and producing a diff color. How can I set the colors of 2 areas to not interfere? Is there a way to give z-index to the areas for this?
Here is my code:
option = {
    title: {
        text: '堆叠区域图'
    },
    tooltip : {
        trigger: 'axis',
        axisPointer: {
            type: 'cross',
        }
    },
    legend: {
        data:['邮件营销','联盟广告','视频广告','直接访问','搜索引擎']
    },
    toolbox: {
        feature: {
            saveAsImage: {}
        }
    },
    grid: {
        left: '3%',
        right: '4%',
        bottom: '3%',
        containLabel: true
    },
    xAxis : [
        {
            type : 'category',
            boundaryGap : false,
            data : ['周一','周二','周三','周四','周五','周六','周日']
        }
    ],
    yAxis : [
        {
            type : 'value'
        }
    ],
    series : [
        {
            name:'联盟广告',
            type:'line',
        smooth: true,
            areaStyle: {color: 'red'},
            data:[170, 182, 161, 184, 160, 180, 165]
        },
        {
            name:'邮件营销',
            type:'line',
        smooth: true,
            areaStyle: {color: 'white'},
            data:[120, 132, 111, 134, 110, 130, 115]
        }
    ]
};
What I have achieved: 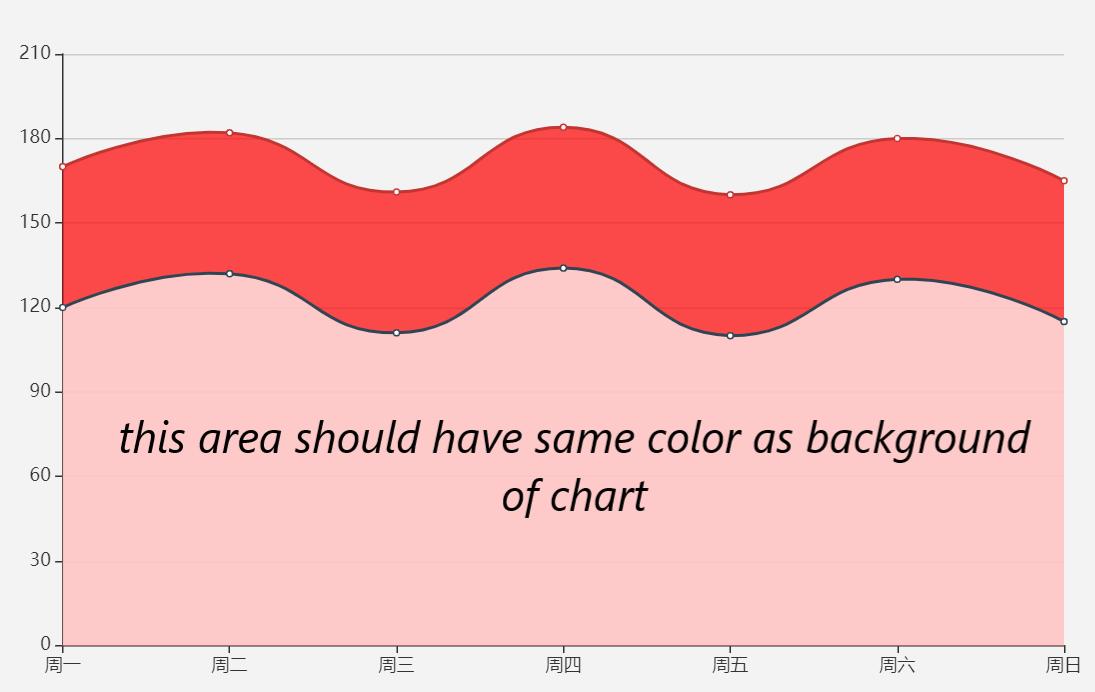
Answers
You need to increase the opacity of the below chart:
option = {
    xAxis: {
        type: 'category',
        boundaryGap: false,
        data: ['Mon', 'Tue', 'Wed', 'Thu', 'Fri', 'Sat', 'Sun']
    },
    yAxis: {
        type: 'value'
    },
    series: [
        {
            z: -1, // optional, makes the yAxis' splitLines appear on top
            data: [170, 182, 161, 184, 160, 180, 165],
            smooth: true,
            type: 'line',
            areaStyle: {}
        },
        {
            z: -1, // optional, makes the yAxis' splitLines appear on top
            data: [120, 132, 111, 134, 110, 130, 115],
            smooth: true,
            type: 'line',
            areaStyle: {
                color: 'rgb(243, 243, 243)', // color of the background
                opacity: 1, // <--- solution
            },
        }
    ]
};

Vue社区为您提供最前沿的新闻资讯和知识内容
更多推荐
 0
0 0
0- 0


 已为社区贡献21229条内容

所有评论(0)