基于XGBoots预测A股大盘《上证指数》(代码+数据+一键可运行)
在股票预测中,AI充当着数据分析和模式识别的角色。虽然无法确保百分之百准确的结果,但它为增加预测的洞察力和理解提供了全新的途径。对AI炒股感兴趣的小伙伴可加WX:caihaihua057200(备注:学校/公司+名字+方向)在这期内容中,我们回到AI预测股票,转而探索人工智能技术如何应用于另一个有趣的领域:预测A股大盘。另外我还有些AI的应用可以一起研究(我一直开源代码)6、结果(预测下周上证:图
·
对AI炒股感兴趣的小伙伴可加WX:caihaihua057200(备注:学校/公司+名字+方向)
或者关注微信公众号《三个篱笆三个帮》我会在里面公开量化股池
另外我还有些AI的应用可以一起研究(我一直开源代码)
1、引言
在这期内容中,我们回到AI预测股票,转而探索人工智能技术如何应用于另一个有趣的领域:预测A股大盘。
2、AI与股票的关系
在股票预测中,AI充当着数据分析和模式识别的角色。虽然无法确保百分之百准确的结果,但它为增加预测的洞察力和理解提供了全新的途径。
3、数据收集与处理(akshare爬实时上证指数)
import akshare as ak
import numpy as np
import pandas as pd
from pandas.tseries.offsets import CustomBusinessDay
from datetime import datetime
import xgboost as xgb


df = ak.stock_zh_index_daily_em(symbol='sh000001')
数据预处理:时间特征转换及时间特征结合K线特征
today = datetime.today()
date_str = today.strftime("%Y%m%d")
base = int(datetime.strptime(date_str, "%Y%m%d").timestamp())
change1 = lambda x: (int(datetime.strptime(x, "%Y%m%d").timestamp()) - base) / 86400
change2 = lambda x: (datetime.strptime(str(x), "%Y%m%d")).day
change3 = lambda x: datetime.strptime(str(x), "%Y%m%d").weekday()

df['date'] = df['date'].str.replace('-', '')
X = df['date'].apply(lambda x: change1(x)).values.reshape(-1, 1)
X_month_day = df['date'].apply(lambda x: change2(x)).values.reshape(-1, 1)
X_week_day = df['date'].apply(lambda x: change3(x)).values.reshape(-1, 1)
XX = np.concatenate((X, X_week_day, X_month_day), axis=1)[29:]
FT = np.array(df.drop(columns=['date']))
min_vals = np.min(FT, axis=0)
max_vals = np.max(FT, axis=0)
FT = (FT - min_vals) / (max_vals - min_vals)

window_size = 30
num_rows, num_columns = FT.shape
new_num_rows = num_rows - window_size + 1
result1 = np.empty((new_num_rows, num_columns))
for i in range(new_num_rows):
    window = FT[i: i + window_size]
    window_mean = np.mean(window, axis=0)
    result1[i] = window_mean

result2 = np.empty((new_num_rows, num_columns))
for i in range(new_num_rows):
    window = FT[i: i + window_size]
    window_mean = np.max(window, axis=0)
    result2[i] = window_mean

result3 = np.empty((new_num_rows, num_columns))
for i in range(new_num_rows):
    window = FT[i: i + window_size]
    window_mean = np.min(window, axis=0)
    result3[i] = window_mean

result4 = np.empty((new_num_rows, num_columns))
for i in range(new_num_rows):
    window = FT[i: i + window_size]
    window_mean = np.std(window, axis=0)
    result4[i] = window_mean
result_list = [result1, result2, result3, result4]
result = np.hstack(result_list)

XX = np.concatenate((XX, result), axis=1)
4、预测模型(XGboots)
y1 = df['open'][29:]
y2 = df['close'][29:]
y3 = df['high'][29:]
y4 = df['low'][29:]
models1 = xgb.XGBRegressor()
models2 = xgb.XGBRegressor()
models3 = xgb.XGBRegressor()
models4 = xgb.XGBRegressor()
models1.fit(XX, y1)
models2.fit(XX, y2)
models3.fit(XX, y3)
models4.fit(XX, y4)
5、应用及画图
start_date = pd.to_datetime(today)
bday_cn = CustomBusinessDay(weekmask='Mon Tue Wed Thu Fri')
future_dates = pd.date_range(start=start_date, periods=6, freq=bday_cn)
future_dates_str = [date.strftime('%Y-%m-%d') for date in future_dates][1:]
future_dates_str = pd.Series(future_dates_str).str.replace('-', '')
X_x = future_dates_str.apply(lambda x: change1(x)).values.reshape(-1, 1)
X_month_day_x = future_dates_str.apply(lambda x: change2(x)).values.reshape(-1, 1)
X_week_day_x = future_dates_str.apply(lambda x: change3(x)).values.reshape(-1, 1)
XXX = np.concatenate((X_x, X_week_day_x, X_month_day_x), axis=1)
last_column = result[-1:, ]
repeated_last_column = np.tile(last_column, (5, 1))
result = repeated_last_column
XXX = np.concatenate((XXX, result), axis=1)
pred1 = models1.predict(XXX)
pred2 = models2.predict(XXX)
pred3 = models3.predict(XXX)
pred4 = models4.predict(XXX)
y1 = np.array(df['open'][-30:])
y2 = np.array(df['close'][-30:])
y3 = np.array(df['high'][-30:])
y4 = np.array(df['low'][-30:])
YD = np.array(df['date'][-30:])
data = {
'open': np.concatenate([y1, pred1]),
'close': np.concatenate([y2, pred2]),
'high': np.concatenate([y3, pred3]),
'low': np.concatenate([y4, pred4]),
'date':np.concatenate([YD,np.array(future_dates_str)])
}
df = pd.DataFrame(data)
import mplfinance as mpf
# df['date'] = pd.date_range(start=RQ, periods=len(df))
df['date'] = pd.to_datetime(df['date'])
df.set_index('date', inplace=True)
# mpf.plot(df, type='candle', title='Stock K-Line')
my_color = mpf.make_marketcolors(up='red', # 上涨时为红色
down='green', # 下跌时为绿色
# edge='i', # 隐藏k线边缘
# volume='in', # 成交量用同样的颜色
inherit=True)
my_style = mpf.make_mpf_style(
# gridaxis='both', # 设置网格
# gridstyle='-.',
# y_on_right=True,
marketcolors=my_color)
mpf.plot(df, type='candle',
style=my_style,
# datetime_format='%Y年%m月%d日',
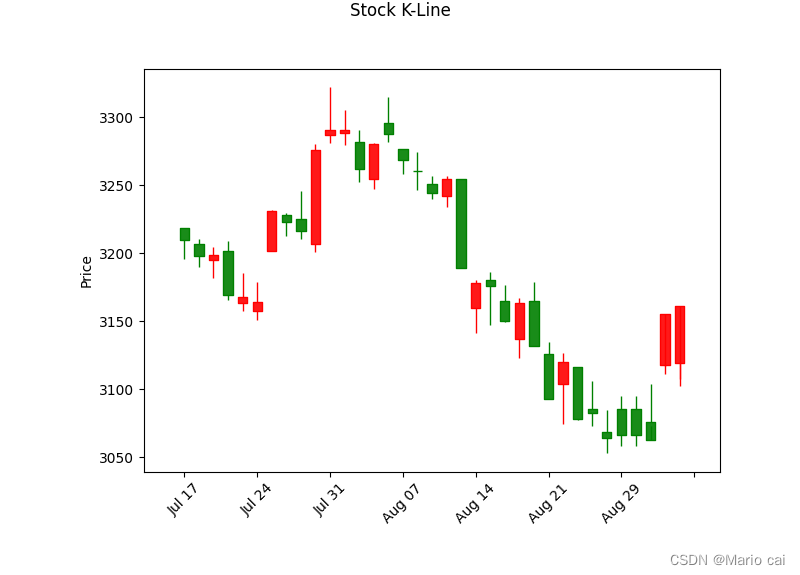
title='Stock K-Line')6、结果(预测下周上证:图中后五天是预测结果)
总结图中所示:
1、周一到周三略微上涨一点点。
2、下周四五高开高走(令人惊讶)。
如果提前布局的话应该是选择在周四找最低点买入。
全代码,一件运行:
import akshare as ak
import numpy as np
import pandas as pd
from pandas.tseries.offsets import CustomBusinessDay
from datetime import datetime
import xgboost as xgb


df = ak.stock_zh_index_daily_em(symbol='sh000001')


today = datetime.today()
date_str = today.strftime("%Y%m%d")
base = int(datetime.strptime(date_str, "%Y%m%d").timestamp())
change1 = lambda x: (int(datetime.strptime(x, "%Y%m%d").timestamp()) - base) / 86400
change2 = lambda x: (datetime.strptime(str(x), "%Y%m%d")).day
change3 = lambda x: datetime.strptime(str(x), "%Y%m%d").weekday()

df['date'] = df['date'].str.replace('-', '')
X = df['date'].apply(lambda x: change1(x)).values.reshape(-1, 1)
X_month_day = df['date'].apply(lambda x: change2(x)).values.reshape(-1, 1)
X_week_day = df['date'].apply(lambda x: change3(x)).values.reshape(-1, 1)
XX = np.concatenate((X, X_week_day, X_month_day), axis=1)[29:]
FT = np.array(df.drop(columns=['date']))
min_vals = np.min(FT, axis=0)
max_vals = np.max(FT, axis=0)
FT = (FT - min_vals) / (max_vals - min_vals)

window_size = 30
num_rows, num_columns = FT.shape
new_num_rows = num_rows - window_size + 1
result1 = np.empty((new_num_rows, num_columns))
for i in range(new_num_rows):
    window = FT[i: i + window_size]
    window_mean = np.mean(window, axis=0)
    result1[i] = window_mean

result2 = np.empty((new_num_rows, num_columns))
for i in range(new_num_rows):
    window = FT[i: i + window_size]
    window_mean = np.max(window, axis=0)
    result2[i] = window_mean

result3 = np.empty((new_num_rows, num_columns))
for i in range(new_num_rows):
    window = FT[i: i + window_size]
    window_mean = np.min(window, axis=0)
    result3[i] = window_mean

result4 = np.empty((new_num_rows, num_columns))
for i in range(new_num_rows):
    window = FT[i: i + window_size]
    window_mean = np.std(window, axis=0)
    result4[i] = window_mean
result_list = [result1, result2, result3, result4]
result = np.hstack(result_list)

XX = np.concatenate((XX, result), axis=1)

y1 = df['open'][29:]
y2 = df['close'][29:]
y3 = df['high'][29:]
y4 = df['low'][29:]
models1 = xgb.XGBRegressor()
models2 = xgb.XGBRegressor()
models3 = xgb.XGBRegressor()
models4 = xgb.XGBRegressor()
models1.fit(XX, y1)
models2.fit(XX, y2)
models3.fit(XX, y3)
models4.fit(XX, y4)

start_date = pd.to_datetime(today)

bday_cn = CustomBusinessDay(weekmask='Mon Tue Wed Thu Fri')
future_dates = pd.date_range(start=start_date, periods=6, freq=bday_cn)
future_dates_str = [date.strftime('%Y-%m-%d') for date in future_dates][1:]
future_dates_str = pd.Series(future_dates_str).str.replace('-', '')
X_x = future_dates_str.apply(lambda x: change1(x)).values.reshape(-1, 1)
X_month_day_x = future_dates_str.apply(lambda x: change2(x)).values.reshape(-1, 1)
X_week_day_x = future_dates_str.apply(lambda x: change3(x)).values.reshape(-1, 1)
XXX = np.concatenate((X_x, X_week_day_x, X_month_day_x), axis=1)
last_column = result[-1:, ]
repeated_last_column = np.tile(last_column, (5, 1))
result = repeated_last_column

XXX = np.concatenate((XXX, result), axis=1)
pred1 = models1.predict(XXX)
pred2 = models2.predict(XXX)
pred3 = models3.predict(XXX)
pred4 = models4.predict(XXX)


y1 = np.array(df['open'][-30:])
y2 = np.array(df['close'][-30:])
y3 = np.array(df['high'][-30:])
y4 = np.array(df['low'][-30:])
YD = np.array(df['date'][-30:])

data = {
    'open': np.concatenate([y1, pred1]),
    'close': np.concatenate([y2, pred2]),
    'high': np.concatenate([y3, pred3]),
    'low': np.concatenate([y4, pred4]),
    'date':np.concatenate([YD,np.array(future_dates_str)])
}

df = pd.DataFrame(data)

import mplfinance as mpf

# df['date'] = pd.date_range(start=RQ, periods=len(df))
df['date'] = pd.to_datetime(df['date'])
df.set_index('date', inplace=True)
# mpf.plot(df, type='candle', title='Stock K-Line')
my_color = mpf.make_marketcolors(up='red',  # 上涨时为红色
                                 down='green',  # 下跌时为绿色
                                 # edge='i',  # 隐藏k线边缘
                                 # volume='in',  # 成交量用同样的颜色
                                 inherit=True)

my_style = mpf.make_mpf_style(
    # gridaxis='both',  # 设置网格
                              # gridstyle='-.',
                              # y_on_right=True,
                              marketcolors=my_color)

mpf.plot(df, type='candle',
         style=my_style,
         # datetime_format='%Y年%m月%d日',
         title='Stock K-Line')

CSDN联合极客时间,共同打造面向开发者的精品内容学习社区,助力成长!
更多推荐


 2
2 0
0- 0


 已为社区贡献3条内容

所有评论(0)