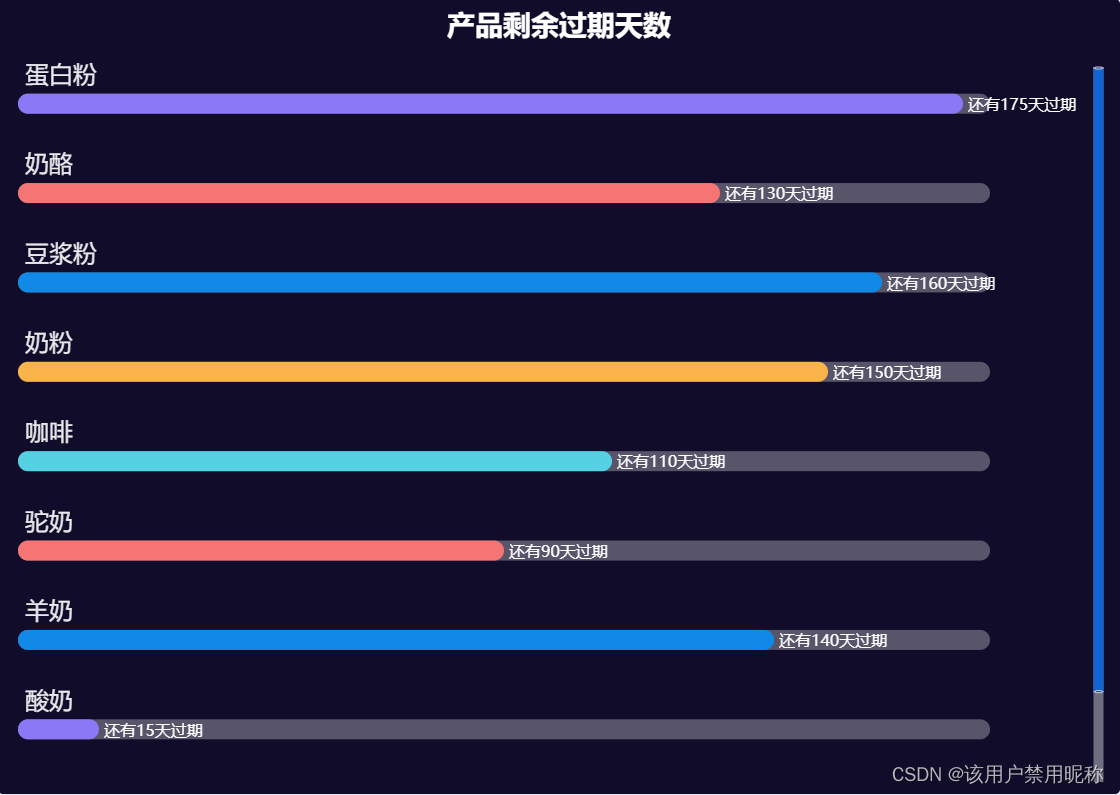
ECharts条形进度图及滚动条设置案例
ECharts条形进度图及滚动条设置案例
·
ECharts条形进度图及纵向滚动条设置案例
简述:
ECharts使用过程中,利用dataZoom设置滚动条,以解决分类过多导致图堆积到一起的情况,本案例中使用的是纵向滚动条;条形进度图是通过两个柱状图叠加实现的,以zlevel值控制显示层级。
下面展示
代码。
更多配置链接: ECharts配置项手册
option = {
  title: [
       {
        text: '产品剩余过期天数',
        left: 'center',
        top: '0',
        textStyle: {
            color: '#fff',
            fontSize: 28,
            align:"center"
        }
    },
],
  grid: {   // 直角坐标系内绘图网格
                        left: '10',  //grid 组件离容器左侧的距离,
                                     //left的值可以是80这样具体像素值,
                        //也可以是'80%'这样相对于容器高度的百分比
                        top: '50',
                        right: '120',
                        bottom: '10',
                        containLabel: false   //gid区域是否包含坐标轴的刻度标签。为true的时候,
                        // left/right/top/bottom/width/height决定的是包括了坐标轴标签在内的
                        //所有内容所形成的矩形的位置.常用于【防止标签溢出】的场景
                    },

  xAxis: {
    type: 'value',
    splitLine: {show: false},//坐标轴在 grid 区域中的分隔线
          axisLabel: {show: false},//坐标轴刻度标签
          axisTick: {show: false},//坐标轴刻度
          axisLine: {show: false},//坐标轴轴线
  },
  yAxis: {
    nameTextStyle: {
      align: 'center',
      verticalAlign: 'middle'
    },
    type: 'category',
          axisTick: {show: false},
          axisLine: {show: false},
          axisLabel: {
          color: 'rgba(255,255,255,.9)',
          fontSize: 24,
          // 调整左侧文字的3个属性,缺一不可
             verticalAlign: 'bottom',
             align:'left',
            //调整文字上右下左
             padding: [0,90,15,15],
        },
        data:['牛奶','酸奶','羊奶','驼奶','咖啡','奶粉','豆浆粉','奶酪','蛋白粉'],
  },
  dataZoom: [//滚动条
                {
                    yAxisIndex: 0,//这里是从X轴的0刻度开始
                    show: true,//是否显示滑动条,不影响使用
                    weight:2,
                    type: 'inside', // 这个 dataZoom 组件是 slider 型 dataZoom 组件
                    startValue: 0, // 从头开始。
                    endValue: 7,  // 一次性展示8个。
                    zoomOnMouseWheel: false,  // 关闭滚轮缩放
                    moveOnMouseWheel: true, // 开启滚轮平移
                    moveOnMouseMove: true  // 鼠标移动能触发数据窗口平移
                },
               {
                   yAxisIndex: 0,//这里是从X轴的0刻度开始
                    show: true,//是否显示滑动条,不影响使用
                    type: 'slider', // 这个 dataZoom 组件是 slider 型 dataZoom 组件
                    fillerColor: "rgba(17, 100, 210, 1)", // 滚动条颜色
                    borderColor: "rgba(17, 100, 210, 0.1)",
                    zoomLock:true, // 是否只平移不缩放
                    handleSize:10, // 两边手柄尺寸
                    width:10,
                    heigh:10,
                    bottom: 2,
                    backgroundColor: 'rgba(255,255,255,.4)',
                    brushSelect:false,
                    showDetail:false,
                    showDataShadow:false
                }
            ],
  series: [
     {
    name: '进度条背景',
    type: 'bar',
    label: { //图形上的文本标签
          show: false,
          position: 'right',//标签的位置
          offset: [0, 0],  //标签文字的偏移,此处表示向上偏移40
                            // formatter: '{c}{a}',//标签内容格式器 {a}-系列名,{b}-数据名,{c}-数据值
          color: 'rgba(255,255,255,.7)',//标签字体颜色
          fontSize: 12  //标签字号
        },
    barGap: '-100%',//不同系列的柱间距离,为百分比。
                            // 在同一坐标系上,此属性会被多个 'bar' 系列共享。
                            // 此属性应设置于此坐标系中最后一个 'bar' 系列上才会生效,
                            //并且是对此坐标系中所有 'bar' 系列生效。
     barWidth: 20,
     data: [180, 180, 180,180,180,180,180,180,180,180],
      color: 'rgba(255,255,255,.3)',//柱条颜色
   itemStyle: {
           normal: {
                 barBorderRadius: 10
                }
          }
    },
    {
      name: '产品过期天数',//系列名称
      type: 'bar',//柱状、条形图
      barWidth: 20,//柱条的宽度,默认自适应
      data: [60, 15, 140, 90, 110, 150, 160, 130, 175, 60],
      label: { //图形上的文本标签
           show: true,
           position: 'right',//标签的位置
           offset: [0, 2],  //标签文字的偏移,此处表示向上偏移2
           formatter: '还有{c}天过期',//标签内容格式器 {a}-系列名,{b}-数据名,{c}-数据值
           color: 'rgba(255,255,255,1)',//标签字体颜色
           fontSize: 16  //标签字号
          },
      itemStyle: {//图形样式
           normal: {  //normal 图形在默认状态下的样式;
                                    //emphasis图形在高亮状态下的样式
           barBorderRadius: 10,//柱条圆角半径,单位px.
                                                        //此处统一设置4个角的圆角大小;
                                    //也可以分开设置[10,10,10,10]顺时针左上、右上、右下、左下
           color : function(params) {
                  let num = myColor.length;   //得到myColor颜色数组的长度
                  return myColor[params.dataIndex % num];   //返回颜色数组中的一个对应的颜色值
                                  },
                  }
              },
           zlevel: 2//柱状图所有图形的 zlevel 值,
                                     //zlevel 大的 Canvas 会放在 zlevel 小的 Canvas 的上面
     },
  ]
};
let myColor =[  '#F57474','#8B78F6','#1089E7', '#F57474', '#56D0E3', '#F8B448', '#1089E7'];
最终效果图

更多推荐
 已为社区贡献1条内容


所有评论(0)