
【Vue中使用Echarts】echarts初体验
ECharts,一个使用 JavaScript 实现的开源可视化库,可以流畅的运行在 PC 和移动设备上,兼容当前绝大部分浏览器(IE8/9/10/11,Chrome,Firefox,Safari等),底层依赖矢量图形库 ZRender,提供直观,交互丰富,可高度个性化定制的数据可视化图表。本文介绍的是vue种如何集成echarts。通过本篇文章初学者可以快速入门在vue中使用echarts。
一、echarts简介
在大数据盛行的今天,数据可视化变得越来越广泛。而在前端工作中,数据可视化用得最多的,可能就是图表了。在众多的图表插件中,echarts以其良好的性能和完善的API,图表的多样性和功能的完整性,被广大开发者认可,成为了前端图表使用最多的工具,所以,今天我就简单的讲一下,如何在vue中更优雅的使用echarts。ECharts是一款基于JavaScript的数据可视化图表库,提供直观,生动,可交互,可个性化定制的数据可视化图表。ECharts最初由百度团队开源,并于2018年初捐赠给Apache基金会,成为ASF孵化级项目。ECharts 提供了常规的折线图、柱状图、散点图、饼图、K线图,用于统计的盒形图,用于地理数据可视化的地图、热力图、线图,用于关系数据可视化的关系图、treemap、旭日图,多维数据可视化的平行坐标,还有用于 BI 的漏斗图,仪表盘,并且支持图与图之间的混搭。ECharts,一个使用 JavaScript 实现的开源可视化库,可以流畅的运行在 PC 和移动设备上,兼容当前绝大部分浏览器(IE8/9/10/11,Chrome,Firefox,Safari等),底层依赖矢量图形库 ZRender,提供直观,交互丰富,可高度个性化定制的数据可视化图表。
特性如下:

- 丰富的图表类型
提供开箱即用的 20 多种图表和十几种组件,并且支持各种图表以及组件的任意组合。
- 强劲的渲染引擎
Canvas、SVG 双引擎一键切换,增量渲染、流加载等技术实现千万级数据的流畅交互。
-
专业的数据分析
通过数据集管理数据,支持数据过滤、聚类、回归,帮助实现同一份数据的多维度分析。
-
优雅的可视化设计
默认设计遵从可视化原则,支持响应式设计,并且提供了灵活的配置项方便开发者定制。
-
健康的开源社区
活跃的社区用户保证了项目的健康发展,也贡献了丰富的第三方插件满足不同场景的需求。
-
友好的无障碍访问
智能生成的图表描述和贴花图案,帮助视力障碍人士了解图表内容,读懂图表背后的故事。
通俗点来说Echarts特点如下:
官网地址:https://www.echartsjs.com/zh/index.html
扩展知识------常见的数据可视化库:
- D3.js 目前 Web 端评价最高的 Javascript 可视化工具库(入手难)
- ECharts.js 百度出品的一个开源 Javascript 数据可视化库
- Highcharts.js 国外的前端数据可视化库,非商用免费,被许多国外大公司所使用
- AntV 蚂蚁金服全新一代数据可视化解决方案 等等
- Highcharts 和 Echarts 就像是 Office 和 WPS 的关系
ECharts,一个使用 JavaScript 实现的开源可视化库,可以流畅的运行在 PC 和移动设备上,兼容当前绝大部分浏览器(IE8/9/10/11,Chrome,Firefox,Safari等),底层依赖矢量图形库 ZRender,提供直观,交互丰富,可高度个性化定制的数据可视化图表。
二、初次体验echarts
1.下载
官网说过,可以通过以下几种方式引入echarts
- 从 Apache ECharts 官网下载界面 获取官方源码包后构建。
- 在 ECharts 的 GitHub 获取。
- 通过 npm 获取 echarts,
npm install echarts --save,详见在 webpack 中使用 echarts - 通过 jsDelivr 等 CDN 引入
这里在vue脚手架内使用的是第三种引入方式,直接将相应的包下载到node_modules内
npm i echarts -save
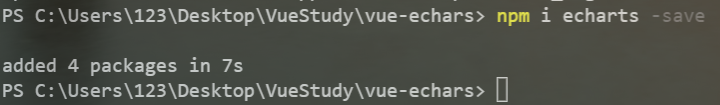
可以看到依赖中已经添加上了

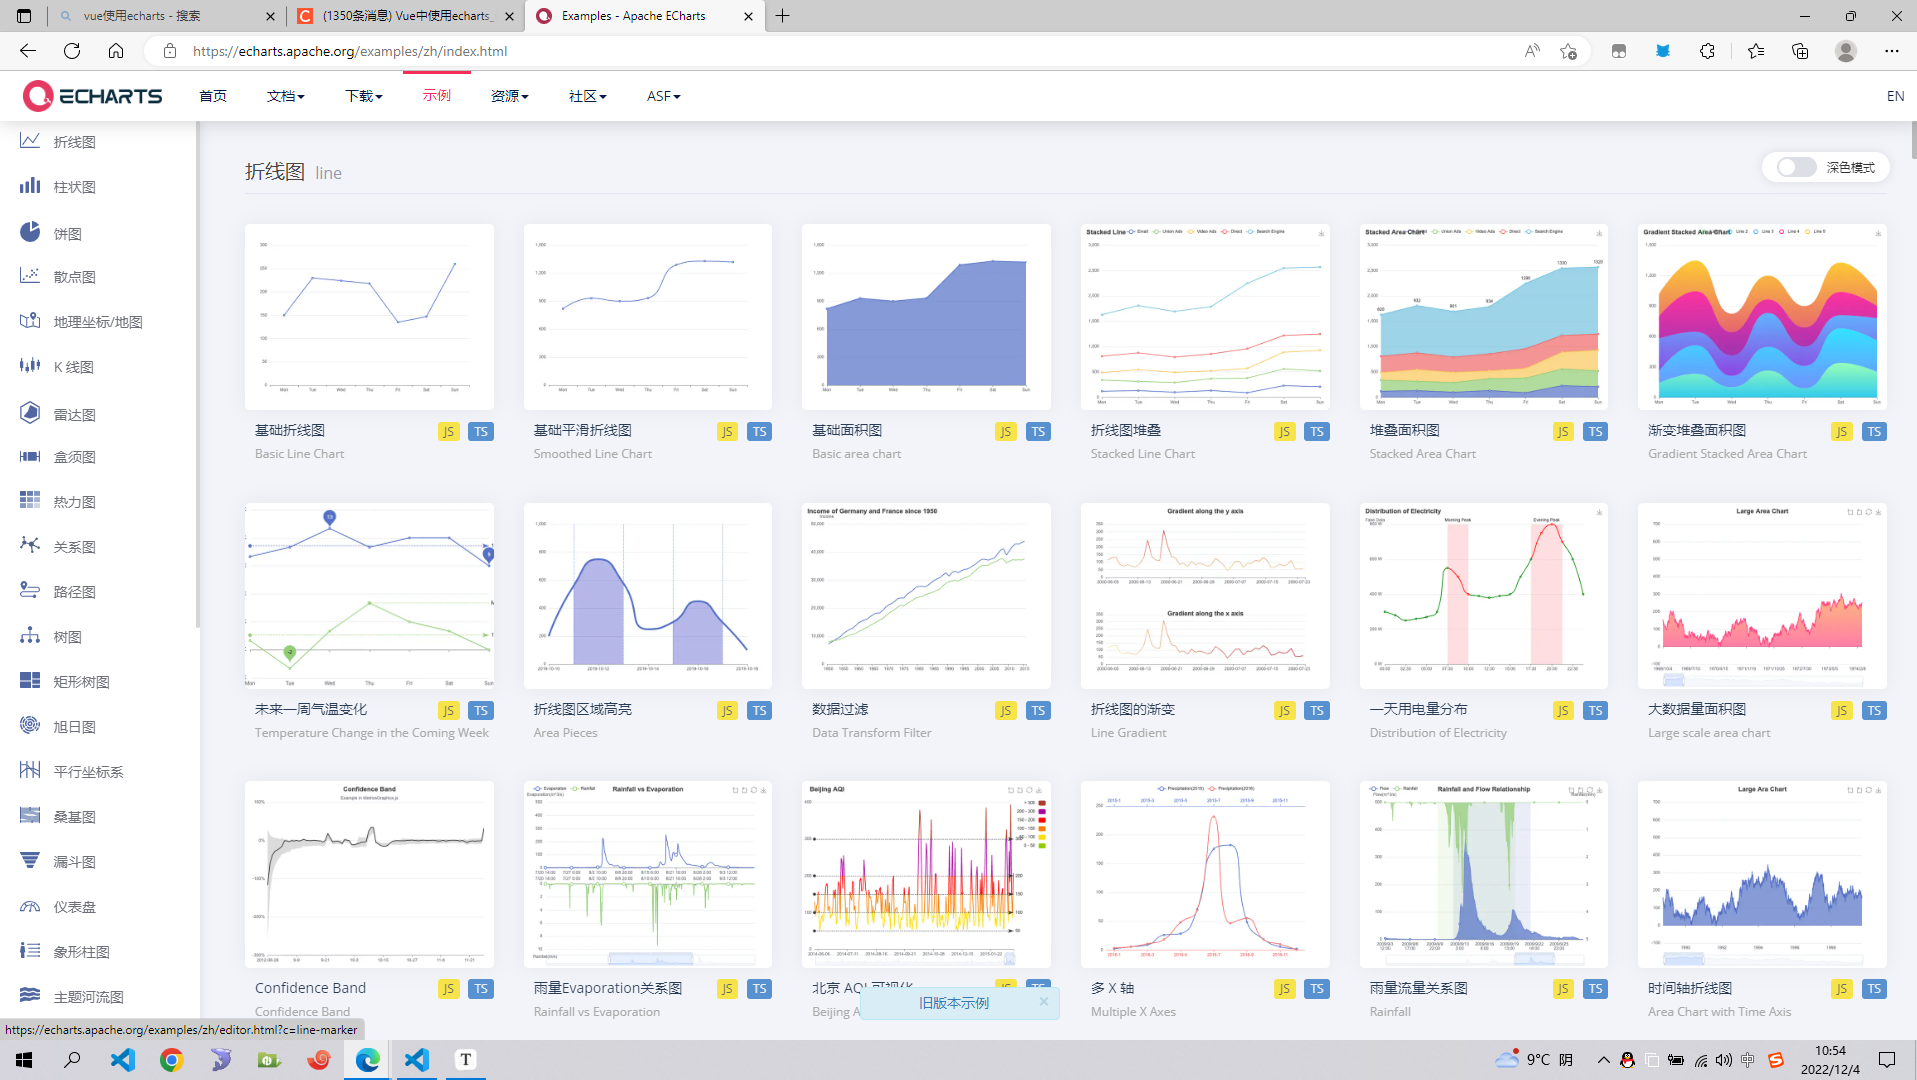
下载完之后可以去echarts官网寻找相应的案例进行体验点击传送:
由于echarts插件是由国人开发,所以官方的文档相当友好,并且提供了许多案例,下面我们找其中的一个案例作为我们今天体验的案例
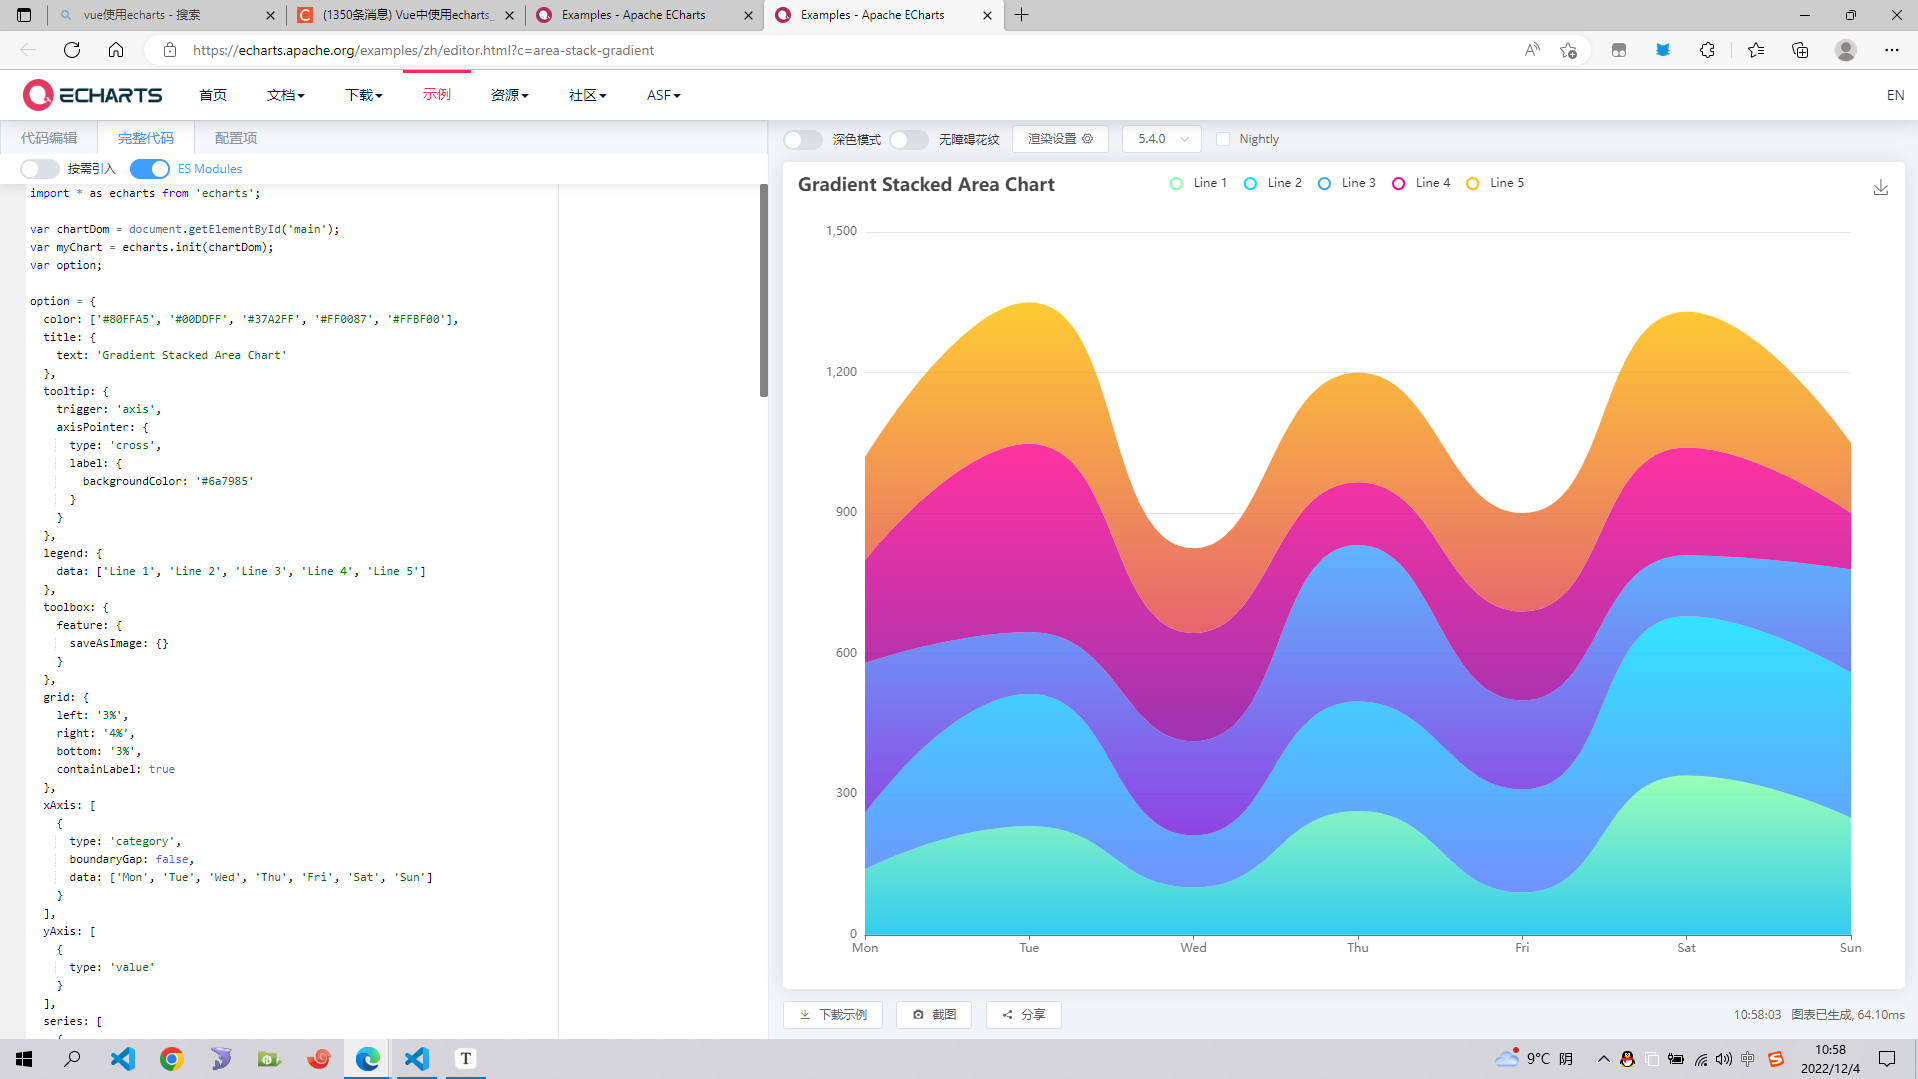
至于代码是什么意思咱们先不要管,只要将案例跑起来后面再去理解代码的意思就很容易了。接下来将以下图案例为例:
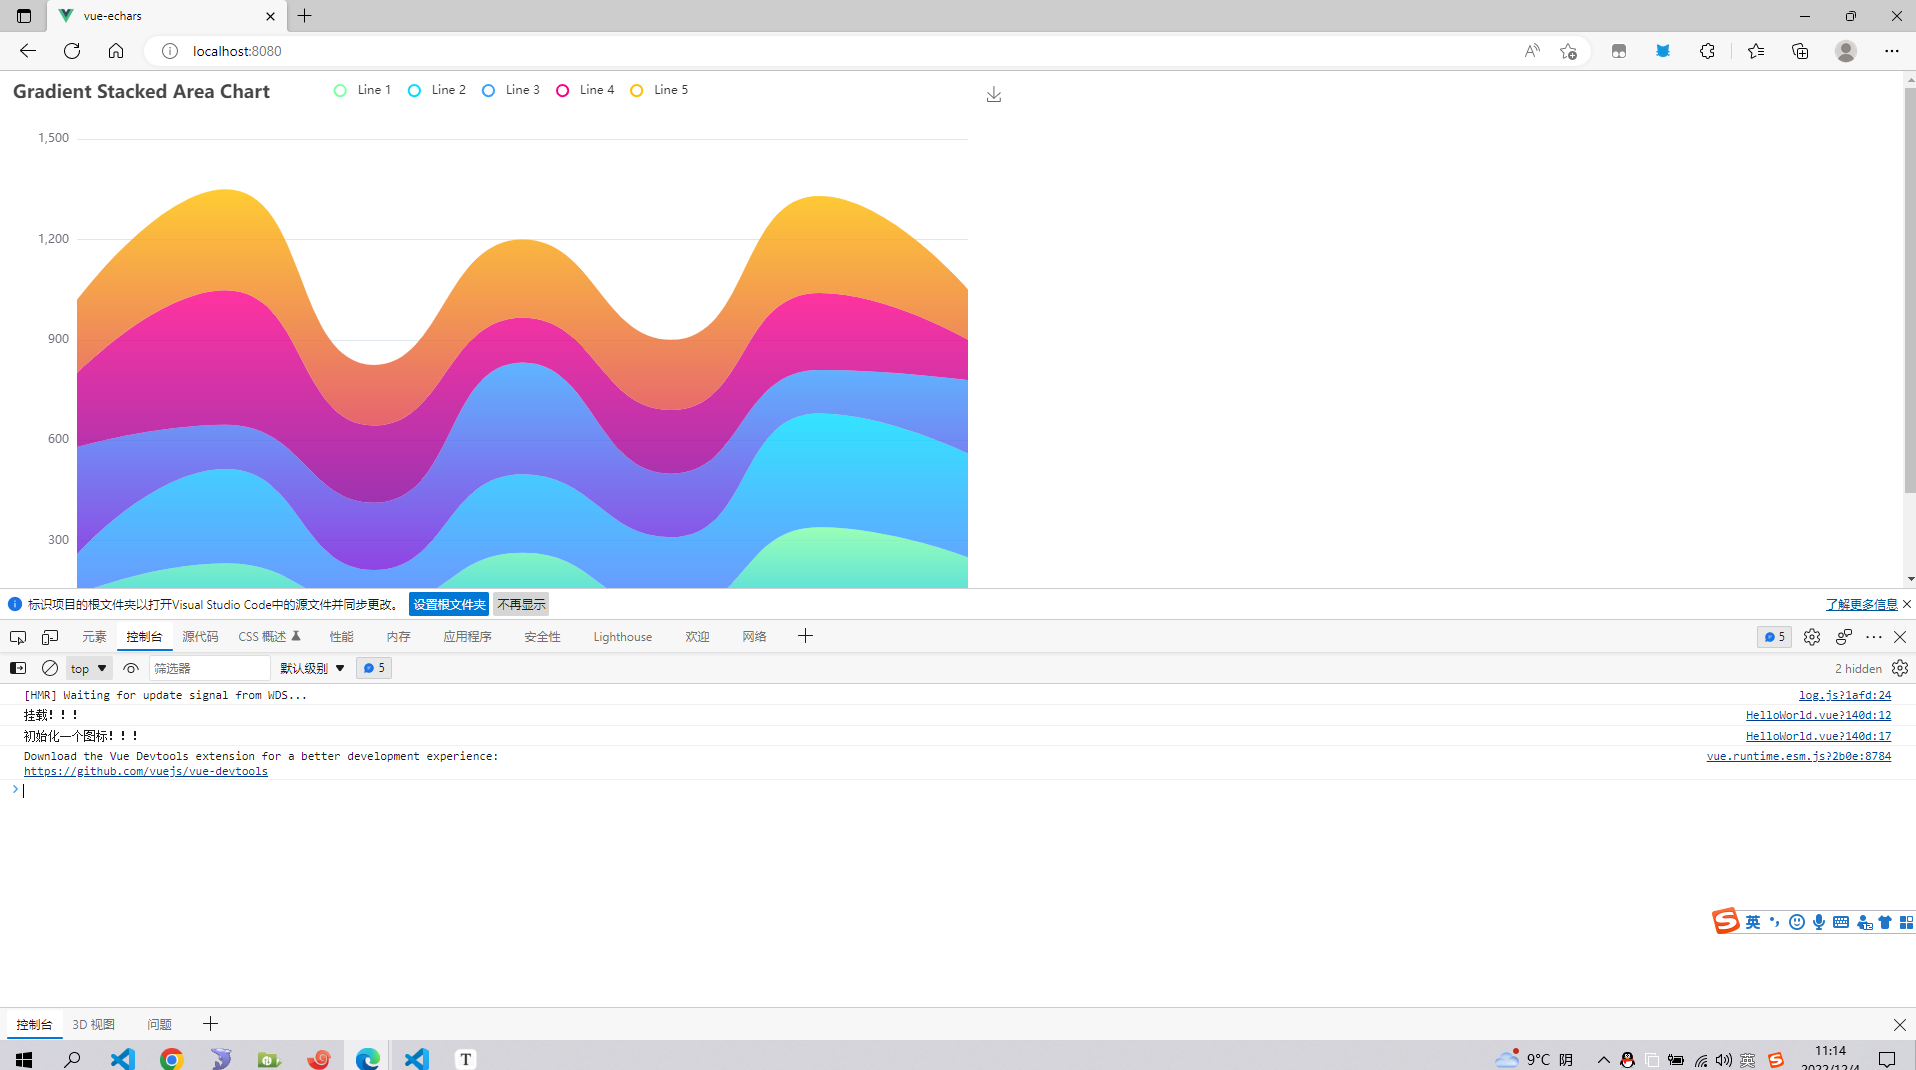
2.在vue中引入echarts
先放运行结果(如图所示):
请记住关键的一步,在一个dom盒子内想要放入一个表格的时候,需要先给dom盒子一个宽高

①全局引入(代码)
main.js
import Vue from 'vue'
import App from './App.vue'
import * as echarts from "echarts"
// 绑定在vue的原型对象上
Vue.prototype.$echarts=echarts
// 关闭生产提示
Vue.config.productionTip = false

new Vue({
  render: h => h(App),
}).$mount('#app')
app.vue
这里做的工作就是在页面挂载完毕后,使用this.$echarts初始化一个表格,并对dom元素进行渲染
mounted()=====>initOneEcharts()
而表格的配置项在initOneEcharts()函数内部
<template>
  <div id="app">hello</div>
</template>

<script>
export default {
  name: "app",
  mounted() {
    console.log("挂载!!!");
    this.initOneEcharts();
  },
  methods: {
    initOneEcharts() {
      console.log("初始化一个图标!!!");
      const option = {
        color: ["#80FFA5", "#00DDFF", "#37A2FF", "#FF0087", "#FFBF00"],
        title: {
          text: "Gradient Stacked Area Chart",
        },
        tooltip: {
          trigger: "axis",
          axisPointer: {
            type: "cross",
            label: {
              backgroundColor: "#6a7985",
            },
          },
        },
        legend: {
          data: ["Line 1", "Line 2", "Line 3", "Line 4", "Line 5"],
        },
        toolbox: {
          feature: {
            saveAsImage: {},
          },
        },
        grid: {
          left: "3%",
          right: "4%",
          bottom: "3%",
          containLabel: true,
        },
        xAxis: [
          {
            type: "category",
            boundaryGap: false,
            data: ["Mon", "Tue", "Wed", "Thu", "Fri", "Sat", "Sun"],
          },
        ],
        yAxis: [
          {
            type: "value",
          },
        ],
        series: [
          {
            name: "Line 1",
            type: "line",
            stack: "Total",
            smooth: true,
            lineStyle: {
              width: 0,
            },
            showSymbol: false,
            areaStyle: {
              opacity: 0.8,
              color: new this.$echarts.graphic.LinearGradient(0, 0, 0, 1, [
                {
                  offset: 0,
                  color: "rgb(128, 255, 165)",
                },
                {
                  offset: 1,
                  color: "rgb(1, 191, 236)",
                },
              ]),
            },
            emphasis: {
              focus: "series",
            },
            data: [140, 232, 101, 264, 90, 340, 250],
          },
          {
            name: "Line 2",
            type: "line",
            stack: "Total",
            smooth: true,
            lineStyle: {
              width: 0,
            },
            showSymbol: false,
            areaStyle: {
              opacity: 0.8,
              color: new this.$echarts.graphic.LinearGradient(0, 0, 0, 1, [
                {
                  offset: 0,
                  color: "rgb(0, 221, 255)",
                },
                {
                  offset: 1,
                  color: "rgb(77, 119, 255)",
                },
              ]),
            },
            emphasis: {
              focus: "series",
            },
            data: [120, 282, 111, 234, 220, 340, 310],
          },
          {
            name: "Line 3",
            type: "line",
            stack: "Total",
            smooth: true,
            lineStyle: {
              width: 0,
            },
            showSymbol: false,
            areaStyle: {
              opacity: 0.8,
              color: new this.$echarts.graphic.LinearGradient(0, 0, 0, 1, [
                {
                  offset: 0,
                  color: "rgb(55, 162, 255)",
                },
                {
                  offset: 1,
                  color: "rgb(116, 21, 219)",
                },
              ]),
            },
            emphasis: {
              focus: "series",
            },
            data: [320, 132, 201, 334, 190, 130, 220],
          },
          {
            name: "Line 4",
            type: "line",
            stack: "Total",
            smooth: true,
            lineStyle: {
              width: 0,
            },
            showSymbol: false,
            areaStyle: {
              opacity: 0.8,
              color: new this.$echarts.graphic.LinearGradient(0, 0, 0, 1, [
                {
                  offset: 0,
                  color: "rgb(255, 0, 135)",
                },
                {
                  offset: 1,
                  color: "rgb(135, 0, 157)",
                },
              ]),
            },
            emphasis: {
              focus: "series",
            },
            data: [220, 402, 231, 134, 190, 230, 120],
          },
          {
            name: "Line 5",
            type: "line",
            stack: "Total",
            smooth: true,
            lineStyle: {
              width: 0,
            },
            showSymbol: false,
            label: {
              show: true,
              position: "top",
            },
            areaStyle: {
              opacity: 0.8,
              color: new this.$echarts.graphic.LinearGradient(0, 0, 0, 1, [
                {
                  offset: 0,
                  color: "rgb(255, 191, 0)",
                },
                {
                  offset: 1,
                  color: "rgb(224, 62, 76)",
                },
              ]),
            },
            emphasis: {
              focus: "series",
            },
            data: [220, 302, 181, 234, 210, 290, 150],
          },
        ],
      };
      this.$echarts.init(document.getElementById("app")).setOption(option);
    },
  },
};
</script>

<style scoped>
#app{
  width: 1000px;
  height: 600px;
}
</style>
② 局部引入
app.vue //展示helloword组件
<template>
  <div id="app"><HelloWorld/></div>
</template>

<script>
import HelloWorld from "./components/HelloWorld.vue"
export default {
  name: "app",
  components:{
    HelloWorld
  }
};
</script>

<style scoped>
#app{
  width: 1000px;
  height: 600px;
}
</style>
helloword //使用echarts渲染出来一个表格
<template>
  <div class="hello">

  </div>
</template>

<script>
import * as echarts from "echarts"
export default {
  name: 'HelloWorld',
  mounted() {
    console.log("挂载!!!");
    this.initOneEcharts();
  },
  methods: {
    initOneEcharts() {
      console.log("初始化一个图标!!!");
      const option = {
        color: ["#80FFA5", "#00DDFF", "#37A2FF", "#FF0087", "#FFBF00"],
        title: {
          text: "Gradient Stacked Area Chart",
        },
        tooltip: {
          trigger: "axis",
          axisPointer: {
            type: "cross",
            label: {
              backgroundColor: "#6a7985",
            },
          },
        },
        legend: {
          data: ["Line 1", "Line 2", "Line 3", "Line 4", "Line 5"],
        },
        toolbox: {
          feature: {
            saveAsImage: {},
          },
        },
        grid: {
          left: "3%",
          right: "4%",
          bottom: "3%",
          containLabel: true,
        },
        xAxis: [
          {
            type: "category",
            boundaryGap: false,
            data: ["Mon", "Tue", "Wed", "Thu", "Fri", "Sat", "Sun"],
          },
        ],
        yAxis: [
          {
            type: "value",
          },
        ],
        series: [
          {
            name: "Line 1",
            type: "line",
            stack: "Total",
            smooth: true,
            lineStyle: {
              width: 0,
            },
            showSymbol: false,
            areaStyle: {
              opacity: 0.8,
              color: new echarts.graphic.LinearGradient(0, 0, 0, 1, [
                {
                  offset: 0,
                  color: "rgb(128, 255, 165)",
                },
                {
                  offset: 1,
                  color: "rgb(1, 191, 236)",
                },
              ]),
            },
            emphasis: {
              focus: "series",
            },
            data: [140, 232, 101, 264, 90, 340, 250],
          },
          {
            name: "Line 2",
            type: "line",
            stack: "Total",
            smooth: true,
            lineStyle: {
              width: 0,
            },
            showSymbol: false,
            areaStyle: {
              opacity: 0.8,
              color: new echarts.graphic.LinearGradient(0, 0, 0, 1, [
                {
                  offset: 0,
                  color: "rgb(0, 221, 255)",
                },
                {
                  offset: 1,
                  color: "rgb(77, 119, 255)",
                },
              ]),
            },
            emphasis: {
              focus: "series",
            },
            data: [120, 282, 111, 234, 220, 340, 310],
          },
          {
            name: "Line 3",
            type: "line",
            stack: "Total",
            smooth: true,
            lineStyle: {
              width: 0,
            },
            showSymbol: false,
            areaStyle: {
              opacity: 0.8,
              color: new echarts.graphic.LinearGradient(0, 0, 0, 1, [
                {
                  offset: 0,
                  color: "rgb(55, 162, 255)",
                },
                {
                  offset: 1,
                  color: "rgb(116, 21, 219)",
                },
              ]),
            },
            emphasis: {
              focus: "series",
            },
            data: [320, 132, 201, 334, 190, 130, 220],
          },
          {
            name: "Line 4",
            type: "line",
            stack: "Total",
            smooth: true,
            lineStyle: {
              width: 0,
            },
            showSymbol: false,
            areaStyle: {
              opacity: 0.8,
              color: new echarts.graphic.LinearGradient(0, 0, 0, 1, [
                {
                  offset: 0,
                  color: "rgb(255, 0, 135)",
                },
                {
                  offset: 1,
                  color: "rgb(135, 0, 157)",
                },
              ]),
            },
            emphasis: {
              focus: "series",
            },
            data: [220, 402, 231, 134, 190, 230, 120],
          },
          {
            name: "Line 5",
            type: "line",
            stack: "Total",
            smooth: true,
            lineStyle: {
              width: 0,
            },
            showSymbol: false,
            label: {
              show: true,
              position: "top",
            },
            areaStyle: {
              opacity: 0.8,
              color: new echarts.graphic.LinearGradient(0, 0, 0, 1, [
                {
                  offset: 0,
                  color: "rgb(255, 191, 0)",
                },
                {
                  offset: 1,
                  color: "rgb(224, 62, 76)",
                },
              ]),
            },
            emphasis: {
              focus: "series",
            },
            data: [220, 302, 181, 234, 210, 290, 150],
          },
        ],
      };
      echarts.init(document.getElementById("app")).setOption(option);
    },
  },
};
</script>

<!-- Add "scoped" attribute to limit CSS to this component only -->
<style scoped>
#hello{
  width: 1000px;
  height: 600px;
}
</style>
至此,我们入门了如何在vue中集成echarts插件,想要将echarts插件玩6还得继续往深的学习。

旨在为数千万中国开发者提供一个无缝且高效的云端环境,以支持学习、使用和贡献开源项目。
更多推荐


 2
2 0
0- 0


 已为社区贡献8条内容

所有评论(0)