prometheus/grafana监控数据收集与展示——k8s从入门到高并发系列教程(九)
基于prometheus和grafana建立我们的检测系统。从docker容器监控、phpfpm监控、nginx监控图标中找出问题的所在
ads:
关注以下公众号查看更多文章

我们用自动化流程把我们提交的代码打包成镜像部署到k8s集群中后,经过jmeter压测发现其实很不理想,在接口返回的正确性和响应时间上都有很大的问题。这并不是我们代码本身写错了什么,因为同样的代码有一半概率是成功执行的。代码的尽头是神学?错,代码的尽头是运维!要想找出原因,我们先建立我们的检测系统。从docker容器监控、phpfpm监控、nginx监控图标中找出问题的所在


Prometheus安装
prometheus内置一个时序数据库,用于对系统运行数据的收集与展示
prometheus amd版本的docker镜像为 prom/prometheus,而arm64处理器的docker镜像为prom/prometheus-linux-arm64,数据存储目录为 /prometheus,需要暴露端口号 9090 供外部访问,配置文件为 /etc/prometheus/prometheus.yml
先创建一个存储卷prometheus-data
apiVersion: v1
kind: PersistentVolumeClaim
metadata:
  name: promethues-data
  namespace: promethues
spec:
  accessModes:
    - ReadWriteOnce
  resources:
    requests:
      storage: 250Mi
  storageClassName: local-path
  volumeMode: Filesystem
创建一个初始化的prometheus配置文件
apiVersion: v1
data:
  prometheus.yml: |-
    global:
      scrape_interval: 2s
      evaluation_interval: 2s
    scrape_configs:
kind: ConfigMap
metadata:
  name: prometheus-config
  namespace: promethues
因为监控系统的特殊权限要求,需要先设置一个prometheus的账户
apiVersion: rbac.authorization.k8s.io/v1
kind: ClusterRole
metadata:
  name: promethues
rules:
- apiGroups: [""]
  resources:
  - nodes
  - nodes/proxy
  - services
  - endpoints
  - pods
  verbs: ["get", "list", "watch"]
- apiGroups:
  - extensions
  resources:
  - ingresses
  verbs: ["get", "list", "watch"]
- nonResourceURLs: ["/metrics"]
  verbs: ["get"]
---
apiVersion: v1
kind: ServiceAccount
metadata:
  name: promethues
  namespace: promethues
---
apiVersion: rbac.authorization.k8s.io/v1
kind: ClusterRoleBinding
metadata:
  name: promethues
roleRef:
  apiGroup: rbac.authorization.k8s.io
  kind: ClusterRole
  name: promethues
subjects:
- kind: ServiceAccount
  name: promethues
  namespace: promethues
创建prometheus的deployment,这个deployment是使用上面创建的service account,并挂载凭证到容器中,容器中的路径为 /var/run/secrets/kubernetes.io/serviceaccount/
apiVersion: apps/v1
kind: Deployment
metadata:
  labels:
    k8s.kuboard.cn/layer: monitor
    k8s.kuboard.cn/name: promethues-k8s
  name: promethues-k8s
  namespace: promethues
spec:
  selector:
    matchLabels:
      k8s.kuboard.cn/layer: monitor
      k8s.kuboard.cn/name: promethues-k8s
  template:
    metadata:
      labels:
        k8s.kuboard.cn/layer: monitor
        k8s.kuboard.cn/name: promethues-k8s
    spec:
      automountServiceAccountToken: true
      containers:
        - image: prom/prometheus-linux-arm64
          name: promethues
          ports:
            - containerPort: 9090
              name: api
              protocol: TCP
          volumeMounts:
            - mountPath: /etc/prometheus
              name: volume-jpcw8
      serviceAccount: promethues
      serviceAccountName: promethues
      volumes:
        - configMap:
            defaultMode: 420
            name: prometheus-config
          name: volume-jpcw8
开放9090端口外网访问,外部端口30044
apiVersion: v1
kind: Service
metadata:
  labels:
    k8s.kuboard.cn/layer: monitor
    k8s.kuboard.cn/name: promethues-k8s
  name: promethues-k8s
  namespace: promethues
spec:
  ports:
    - name: 8jmgrm
      nodePort: 30044
      port: 9090
      protocol: TCP
      targetPort: 9090
  selector:
    k8s.kuboard.cn/layer: monitor
    k8s.kuboard.cn/name: promethues-k8s
  type: NodePort
这样,可以访问 http://127.0.0.1:30044/ 查看prometheus界面了
cadvisor抓取节点容器中的cpu内存信息
prometheus.yml文件中增加以下job,通过cadvisor抓取节点容器中的cpu内存信息
- job_name: 'kubernetes-pods'
  scheme: https
  tls_config:
    ca_file: /var/run/secrets/kubernetes.io/serviceaccount/ca.crt
  bearer_token_file: /var/run/secrets/kubernetes.io/serviceaccount/token
  kubernetes_sd_configs:
  - role: node
  relabel_configs:
  - target_label: __address__
    replacement: kubernetes.default.svc:443
  - source_labels: [__meta_kubernetes_node_name]
    regex: (.+)
    target_label: __metrics_path__
replacement: /api/v1/nodes/${1}/proxy/metrics/cadvisor- 使用promethues这个service account访问抓取节点
- 通过k8s的/proxy/metrics/cadvisor这个api抓取容器cpu内存信息,使用https协议抓取
- __address__ 当前Target实例的访问地址<host>:<port>
- __metrics_path__:采集目标服务访问地址的访问路径,从 __meta_kubernetes_node_name 中提取数值填充节点名称
- 把__meta_kubernetes_node_label_ 开头的标签全部入库
重启deployment,在promethues的 status->targes可以看到如下内容

可以看到kubernetes这个job的数据抓取地址为 https://kubernetes.default.svc/api/v1/nodes/primary/proxy/metrics/cadvisor
打开kubectl proxy,看到输出
Starting to serve on 127.0.0.1:8001
新开一个窗口,把 https://kubernetes.default.svc 替换成 http://127.0.0.1:8001, curl访问试试
curl http://127.0.0.1:8001/api/v1/nodes/primary/proxy/metrics/cadvisor | grep HELP | grep cpu最后找到cpu占用比率的百分比查询字段为
container_cpu_load_average_10s{namespace="test-project1",image=~".*mustafa_project.*"}
从图像上来看,即使请求失败,cpu并没有产生什么变化
内存占用比率的百分比查询字段为
container_memory_usage_bytes{namespace="test-project1",image=~".*mustafa_project.*"}/container_spec_memory_limit_bytes{namespace="test-project1",image=~".*mustafa_project.*"}
从这张图可以看出,内存占比不到10%,但接口请求已经出现失败的情况了,所以失败的原因目前并不在cpu和内存。
下面我们开始监控php-fpm
安装php-fpm-exporter
phpfpm-exporter 的github地址为 https://github.com/bakins/php-fpm-exporter.git ,我们使用镜像多阶段构建,启动一个go语言的容器,进行编译,把编译好的可执行文件放到自己phpfpm镜像的/usr/local/bin目录下
phpfpm项目的dockerfile文件头部增加以下内容
FROM golang:buster as builder-golang

RUN git clone https://ghproxy.com/https://github.com/bakins/php-fpm-exporter.git /tmp/php-fpm-exporter \
    && cd /tmp/php-fpm-exporter && sed -i 's/amd64/arm64/g' script/build \
    && ./script/build && chmod +x php-fpm-exporter.linux.arm64

FROM php:7.2-fpm as final

COPY --from=builder-golang /tmp/php-fpm-exporter/php-fpm-exporter.linux.arm64 /usr/local/bin/php-fpm-exporter
就是修改那个git项目的script/build文件,啊amd64换成arm64进行编译,最后把编译好的可执行文件拷贝的自己的镜像中
phpfpm开启监控
修改phpfpm的www.conf文件,修改以下内容
pm.status_path = /php_status
ping.path = /ping
这样访问php_status可以抓取到php的状态信息
启动phpfom-export向外部发送php_status信息,修改entry.sh文件
#!/bin/sh

php-fpm -D

nginx

php-fpm-exporter --addr="0.0.0.0:9190" --fastcgi="tcp://127.0.0.1:9000/php_status"在9190端口抓取php_status信息
需要一个service公开9190端口给promethus查询
apiVersion: v1
kind: Service
metadata:
  name: test-client1
spec:
  ports:
    - name: http-api
      protocol: TCP
      port: 80
      targetPort: 80
    - name: http-php-fpm
      protocol: TCP
      port: 9190
      targetPort: 9190
  selector:
    app: test-client1
配置prometheus抓取php-fpm信息
上面prometheus是自动发现nodes,然后接口拿nodes上的cadvisor接口内容获取容器的cpu、内存信息,这次是prometheus自动发现pods,获取pod的9190端口内容来抓取php-fpm,并且只抓取project1的命令空间
- job_name: 'php-fpm'
  scheme: http
  tls_config:
    ca_file: /var/run/secrets/kubernetes.io/serviceaccount/ca.crt
    insecure_skip_verify: true
  bearer_token_file: /var/run/secrets/kubernetes.io/serviceaccount/token
  kubernetes_sd_configs:
  - role: pod
  relabel_configs:
  - action: labelmap
    regex: __meta_kubernetes_pod_label_(.+)
  - source_labels: [__meta_kubernetes_namespace]
    action: keep
    regex: .*project1.*
  - source_labels: [__meta_kubernetes_namespace]
    action: replace
    target_label: kubernetes_namespace
  - source_labels: [__meta_kubernetes_pod_ip]
    action: replace
    regex: (.+)
    target_label: __address__
    replacement: ${1}:9190
实际上抓了两个pod的phpfpm信息

访问了一下这个endporints,看看返回
➜ ~ curl http://10.42.0.20:9190/metrics
# HELP phpfpm_accepted_connections_total Total number of accepted connections
# TYPE phpfpm_accepted_connections_total counter
phpfpm_accepted_connections_total 145
# HELP phpfpm_active_max_processes Maximum active process count
# TYPE phpfpm_active_max_processes counter
phpfpm_active_max_processes 1
# HELP phpfpm_listen_queue_connections Number of connections that have been initiated but not yet accepted
# TYPE phpfpm_listen_queue_connections gauge
phpfpm_listen_queue_connections 0
# HELP phpfpm_listen_queue_length_connections The length of the socket queue, dictating maximum number of pending connections
# TYPE phpfpm_listen_queue_length_connections gauge
phpfpm_listen_queue_length_connections 511
# HELP phpfpm_listen_queue_max_connections Max number of connections the listen queue has reached since FPM start
# TYPE phpfpm_listen_queue_max_connections counter
phpfpm_listen_queue_max_connections 0
# HELP phpfpm_max_children_reached_total Number of times the process limit has been reached
# TYPE phpfpm_max_children_reached_total counter
phpfpm_max_children_reached_total 0
# HELP phpfpm_processes_total process count
# TYPE phpfpm_processes_total gauge
phpfpm_processes_total{state="active"} 1
phpfpm_processes_total{state="idle"} 1
# HELP phpfpm_scrape_failures_total Number of errors while scraping php_fpm
# TYPE phpfpm_scrape_failures_total counter
phpfpm_scrape_failures_total 0
# HELP phpfpm_slow_requests_total Number of requests that exceed request_slowlog_timeout
# TYPE phpfpm_slow_requests_total counter
phpfpm_slow_requests_total 0
# HELP phpfpm_up able to contact php-fpm
# TYPE phpfpm_up gauge
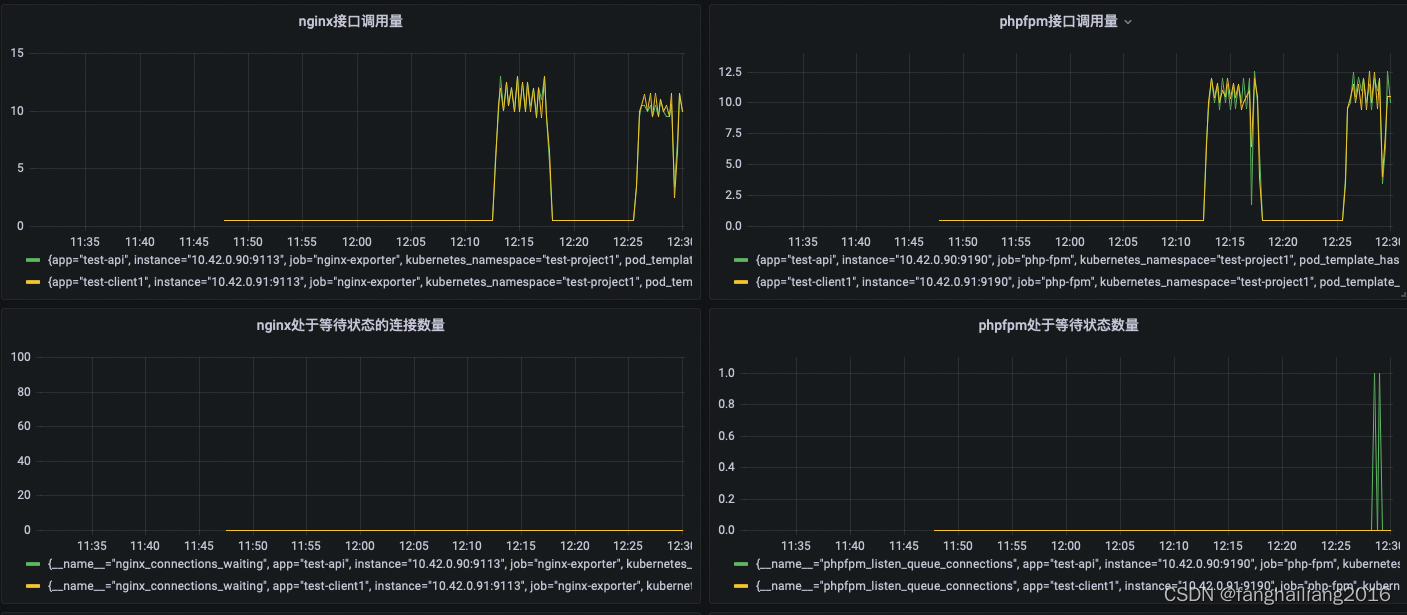
phpfpm_up 1查看请求量变化
irate(phpfpm_accepted_connections_total{app="test-client1"}[1m])
查看phpfpm等待队列的长度
phpfpm_listen_queue_connections查看活跃的php-fpm进程数
phpfpm_processes_total{state="active"}
api项目偶尔有5个php-fpm进程在运行,而client1项目则始终只有一个php-fpm进程运行,这造成了php-fpm有时候来不及处理接口调用,导致微服务超时
phpfpm进程数优化
单个docker容器中phpfpm进程数设为固定数量,当请求量增加时可以使用k8s的自动扩容提升并发处理的能力,phpfpm进程数的设置数量为 内存容量/30M 大约4个到5个
pm = static
pm.max_children = 5sum(phpfpm_processes_total{app="test-client1"})这样查询phpfpm进程数始终是5个了
安装nginx-exporter
监控nginx需要安装nginx-exporter
# 安装nginx-exporter
RUN curl https://ghproxy.com/https://github.com/nginxinc/nginx-prometheus-exporter/releases/download/v0.11.0/nginx-prometheus-exporter_0.11.0_linux_arm64.tar.gz -o /tmp/nginx-prometheus-exporter.tar.gz \
    && cd /tmp && tar zxvf nginx-prometheus-exporter.tar.gz \
    && mv nginx-prometheus-exporter /usr/local/bin/nginx-prometheus-exporter \
    && rm -rf /tmp/*
nginx开启监控需要在站点配置文件中增加网络入口
	location /nginx-status {
        stub_status;

        access_log off;
        allow 127.0.0.1;
        deny all;
    }
修改启动脚本,在 9113 端口抓取nginx状态描述
#!/bin/sh

php-fpm -D

nginx

nohup php-fpm-exporter --addr="0.0.0.0:9190" --fastcgi="tcp://127.0.0.1:9000/php_status" &

nginx-prometheus-exporter -nginx.scrape-uri=http://127.0.0.1/stub_status
需要一个service公开9113端口给promethus查询
    - name: http-nginx-exporter
      protocol: TCP
      port: 9113
      targetPort: 9113
配合prometheus抓取nginx-export的状态信息
- job_name: 'nginx-exporter'
  scheme: http
  tls_config:
    ca_file: /var/run/secrets/kubernetes.io/serviceaccount/ca.crt
    insecure_skip_verify: true
  bearer_token_file: /var/run/secrets/kubernetes.io/serviceaccount/token
  kubernetes_sd_configs:
  - role: pod
  relabel_configs:
  - action: labelmap
    regex: __meta_kubernetes_pod_label_(.+)
  - source_labels: [__meta_kubernetes_namespace]
    action: keep
    regex: .*project1.*
  - source_labels: [__meta_kubernetes_namespace]
    action: replace
    target_label: kubernetes_namespace
  - source_labels: [__meta_kubernetes_pod_ip]
    action: replace
    regex: (.+)
    target_label: __address__
    replacement: ${1}:9113
nginx-exporter抓出来的内容
# HELP nginx_connections_accepted Accepted client connections
# TYPE nginx_connections_accepted counter
nginx_connections_accepted 2
# HELP nginx_connections_active Active client connections
# TYPE nginx_connections_active gauge
nginx_connections_active 1
# HELP nginx_connections_handled Handled client connections
# TYPE nginx_connections_handled counter
nginx_connections_handled 2
# HELP nginx_connections_reading Connections where NGINX is reading the request header
# TYPE nginx_connections_reading gauge
nginx_connections_reading 0
# HELP nginx_connections_waiting Idle client connections
# TYPE nginx_connections_waiting gauge
nginx_connections_waiting 0
# HELP nginx_connections_writing Connections where NGINX is writing the response back to the client
# TYPE nginx_connections_writing gauge
nginx_connections_writing 1
# HELP nginx_http_requests_total Total http requests
# TYPE nginx_http_requests_total counter
nginx_http_requests_total 23
# HELP nginx_up Status of the last metric scrape
# TYPE nginx_up gauge
nginx_up 1
# HELP nginxexporter_build_info Exporter build information
# TYPE nginxexporter_build_info gauge
nginxexporter_build_info{arch="linux/arm64",commit="e4a6810d4f0b776f7fde37fea1d84e4c7284b72a",date="2022-09-07T21:09:51Z",dirty="false",go="go1.19",version="0.11.0"} 1
查询nginx接口调用量
irate(nginx_http_requests_total{app="test-api"}[1m])
查询使用中的连接数
nginx_connections_active{app="test-api"}
grafana制作可视化面板
创建grafana的数据存储卷
apiVersion: v1
kind: PersistentVolumeClaim
metadata:
  annotations:
    k8s.kuboard.cn/pvcType: Dynamic
  name: grafana
  namespace: promethues
spec:
  accessModes:
    - ReadWriteOnce
  resources:
    requests:
      storage: 50Mi
  storageClassName: local-path
  volumeMode: Filesystem
创建grafana deployment
apiVersion: apps/v1
kind: Deployment
metadata:
  labels:
    k8s.kuboard.cn/layer: web
    k8s.kuboard.cn/name: grafana-k8s
  name: grafana-k8s
  namespace: promethues
spec:
  selector:
    matchLabels:
      k8s.kuboard.cn/layer: web
      k8s.kuboard.cn/name: grafana-k8s
  template:
    metadata:
      labels:
        k8s.kuboard.cn/layer: web
        k8s.kuboard.cn/name: grafana-k8s
    spec:
      containers:
        - image: grafana/grafana
          imagePullPolicy: IfNotPresent
          name: grafana
          ports:
            - containerPort: 3000
              name: grafana
              protocol: TCP
          volumeMounts:
            - mountPath: /var/lib/grafana
              name: volume-62hxi
      volumes:
        - name: volume-62hxi
          persistentVolumeClaim:
            claimName: grafana
创建grafana service
apiVersion: v1
kind: Service
metadata:
  labels:
    k8s.kuboard.cn/layer: web
    k8s.kuboard.cn/name: grafana-k8s
  name: grafana-k8s
  namespace: promethues
spec:
  ports:
    - name: ytfnyw
      nodePort: 31968
      port: 3000
      protocol: TCP
      targetPort: 3000
  selector:
    k8s.kuboard.cn/layer: web
    k8s.kuboard.cn/name: grafana-k8s
  type: NodePort
可以打开 http://127.0.0.1:31968/login 访问grafana,登陆账号 admin 密码 admin
grafana配置prometheus数据源

点击配置 -> 数据源,选择 prometheus,数据源地址写 http://promethues-k8s:9090

新增看板 new dashboard,选择 add new panel
内存监控

接口调用量监控

处于等待状态phpfpm连接监控

phpfpm数量监控

面板总体效果

相关链接
常用开发工具:php_codesniffer代码规范检查&修复、phpstan语法检查、phpunit单元测试
.gitlab-ci.yaml自动镜像打包&&互联网企业规范化上线流程(上)

K8S/Kubernetes社区为您提供最前沿的新闻资讯和知识内容
更多推荐
 0
0 0
0- 0


 已为社区贡献17条内容

所有评论(0)