
【python 数据挖掘】基于matplotlib的绘图二:figure、axes的基本属性和方法,主副刻度、定位器
python绘图figure、axes参数设置,主副刻度的理解
·
python绘图2
- figure是指承载各个坐标区域的基础,我一般喜欢叫它图床,具体中文怎么翻译我没有深究;axes就是指图床上的各个坐标区域了,默认是一个坐标区域,可以通过
plt.subplot()产生多个坐标区域,每个坐标区域可以单独控制。 - figure和axes的属性:更具体地可查看https://matplotlib.org/stable/api/figure_api.html
- 主刻度:major tick;副刻度:minor tick(副刻度之间的间隔,就是坐标轴的分度值):主副刻度可查看:https://matplotlib.org/stable/api/ticker_api.html
- 小实验:
import numpy as np
import matplotlib
import matplotlib.pyplot as plt
from fractions import Fraction
from matplotlib.ticker import MultipleLocator,FuncFormatter,AutoLocator,AutoMinorLocator


fig = plt.figure(figsize=(16,12),dpi=300)
ax1 = plt.subplot(221) #分成田字格,第一格
ax3 = plt.subplot(223) #第三格
ax4 = plt.subplot(224)
x = np.arange(0,4*np.pi,0.1)
y1 = np.sin(x)
y2 = np.cos(x)
ax1.plot(x,y1,x,y2)
ax3.scatter(x,x,s=0.2,color='r')
ax3.scatter(x,y1,s=0.2,color='blue')

#主刻度文本的计算
def pi_formatter(x,pos):
    frac=Fraction(int(np.round(x/(np.pi/4))),4)
    d,n=frac.denominator,frac.numerator
    if frac==0:
        return '0'
    elif frac==1:
        return '$\pi$'
    elif d==1:
        return r'$%d \pi$'%n
    elif n==1:
        return r'$\frac{\pi}{%d}$'%d
    return r'$\frac{%d \pi}{%d}$'%(n,d)

#设置两坐标轴的范围,注意此时设置的是ax3的属性,因为最后生成的是ax3,
    #那么gca()就是ax3,直接用plt默认设置的是gca()的轴参数
plt.xlim(0,np.max(x))
plt.ylim(-1.5,1.5)
    # 如果我要设置ax1的参数:注意方法有点不一样
ax1.set_xlim(-np.pi/2,np.max(x)+np.pi/2)
ax1.set_ylim(-3,3)

#设置ax3图的底边距
plt.subplots_adjust(bottom=0.15)

#开启ax3和ax1网格
plt.grid()
ax1.grid()

#设置ax1主刻度位置为pi/4的整数倍,注意参数是
ax1.xaxis.set_major_locator(MultipleLocator(np.pi/4))
#ax1副刻度位置为pi/20的整数倍
ax1.xaxis.set_minor_locator(MultipleLocator(np.pi/20))

#自动设置主副刻度
ax3.xaxis.set_major_locator(AutoLocator())
ax3.xaxis.set_minor_locator(AutoMinorLocator())

#ax1刻度文本用pi_formatter计算
ax1.xaxis.set_major_formatter(FuncFormatter(pi_formatter))
#ax1主刻度文本大小
for label in ax1.xaxis.get_ticklabels():
    label.set_fontsize(16)
[外链图片转存失败,源站可能有防盗链机制,建议将图片保存下来直接上传(img-5l20E4Dj-1641914262860)(C:/Users/%E7%8E%8B%E5%AE%88%E5%9B%BD/AppData/Roaming/Typora/typora-user-images/image-20220110233931035.png)]
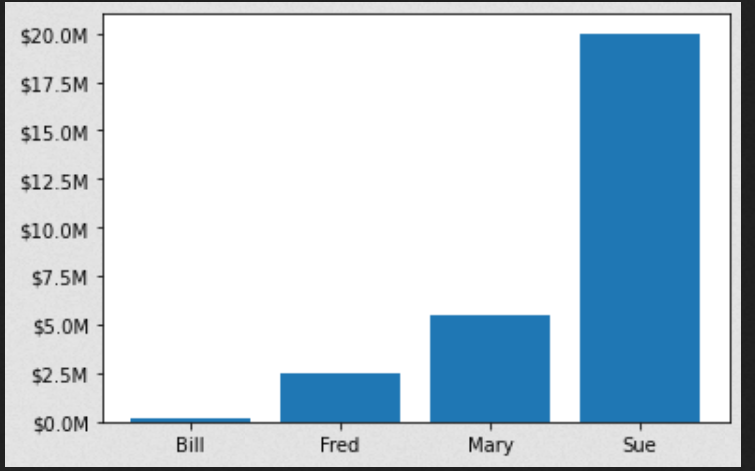
- 关于FuncFormatter的用法,stack overflow上有个老哥给了个例子,挺好理解的
官方文档:
class matplotlib.ticker.FuncFormatter(func)[source]
Bases:
matplotlib.ticker.FormatterUse a user-defined function for formatting.
The function should take in two inputs (a tick value
xand a positionpos), and return a string containing the corresponding tick label.
from matplotlib.ticker import FuncFormatter
import matplotlib.pyplot as plt
import numpy as np

x = np.arange(4)
money = [1.5e5, 2.5e6, 5.5e6, 2.0e7]


def millions(x, pos):
    'The two args are the value and tick position'
    return '$%1.1fM' % (x*1e-6)

formatter = FuncFormatter(millions)

fig, ax = plt.subplots()
ax.yaxis.set_major_formatter(formatter)
plt.bar(x, money)
plt.xticks(x, ('Bill', 'Fred', 'Mary', 'Sue'))
plt.show()

鸿蒙生态一站式服务平台。
更多推荐
 0
0 0
0- 0


 已为社区贡献1条内容

所有评论(0)