
Prometheus完整搭建及实战各种监控
一.Prometheus介绍Prometheus(普罗米修斯)是一个最初在SoundCloud上构建的监控系统。自2012年成为社区开源项目,拥有非常活跃的开发人员和用户社区。为强调开源及独立维护,Prometheus于2016年加入云原生云计算基金会(CNCF),成为继Kubernetes之后的第二个托管项目。https://prometheus.ioPrometheus · GitHub作为新
一.Prometheus介绍
Prometheus(普罗米修斯)是一个最初在SoundCloud上构建的监控系统。自2012年成为社区开源项目,拥有非常活跃的开发人员和用户社区。为强调开源及独立维护,Prometheus于2016年加入云原生云计算基金会(CNCF),成为继Kubernetes之后的第二个托管项目。
https://prometheus.io
Prometheus · GitHub
作为新一代的监控框架,Prometheus 具有以下特点:
• 多维数据模型:由度量名称和键值对标识的时间序列数据
• PromSQL:一种灵活的查询语言,可以利用多维数据完成复杂的查询
• 不依赖分布式存储,单个服务器节点可直接工作
• 基于HTTP的pull方式采集时间序列数据
• 推送时间序列数据通过PushGateway组件支持
• 通过服务发现或静态配置发现目标
• 多种图形模式及仪表盘支持
Prometheus适用于以机器为中心的监控以及高度动态面向服务架构的监控。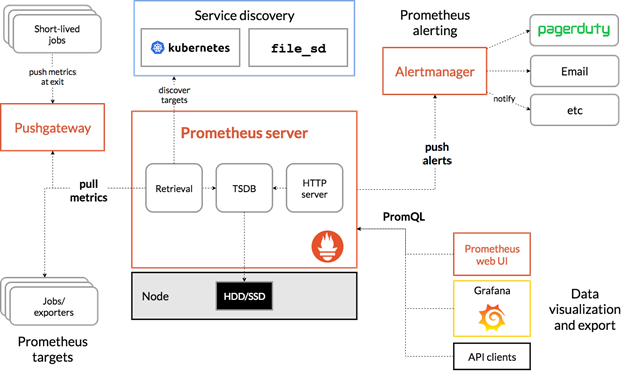
二.Prometheus部署
转载:绿色记忆:Prometheus学习笔记
1.安装环境:
server1:centos7.6 主节点 190.168.3.250
server2:centos7.6 节点1 190.168.3.251
为您的平台下载最新版本的Prometheus,然后解压缩并运行它:
2.二进制安装
tar xvfz prometheus-2.15.0.linux-amd64.tar.gz
cd prometheus-2.15.0.linux-amd64
mv prometheus-2.15.0.linux-amd64 /usr/local/prometheus
启动
./prometheus --config.file=prometheus.yml
为了方便,加入到服务配置文件里
vi /usr/lib/systemd/system/prometheus.service
[Unit]
Description=https://prometheus.io
[Service]
Restart=on-failure
ExecStart=/usr/local/prometheus/prometheus --config.file=/usr/local/prometheus/prometheus.yml
[Install]
WantedBy=multi-user.target
重启服务
systemctl daemon-reload
systemctl start prometheus.service
3.容器安装
Installation | Prometheus
prometheus.yml通过运行以下命令将您从主机绑定:
docker run -p 9090:9090 -v /tmp/prometheus.yml:/etc/prometheus/prometheus.yml \
prom/prometheus
或者为配置使用额外的卷:
docker run -p 9090:9090 -v /prometheus-data \
prom/prometheus --config.file=/prometheus-data/prometheus.yml
4.访问web
http://190.168.3.250:9090访问自己的状态页面
可以通过访问localhost:9090验证Prometheus自身的指标:190.168.3.250:9090/metrics
三.配置监控服务
1.配置Prometheus监控本身
全局配置文件简介
有关配置选项的完整,请参阅:Configuration | Prometheus
Prometheus以scrape_interval规则周期性从监控目标上收集数据,然后将数据存储到本地存储上。scrape_interval可以设定全局也可以设定单个metrics。
Prometheus以evaluation_interval规则周期性对告警规则做计算,然后更新告警状态。evaluation_interval只有设定在全局。
global:全局配置
alerting:告警配置
rule_files:告警规则
scrape_configs:配置数据源,称为target,每个target用job_name命名。又分为静态配置和服务发现
global:
默认抓取周期,可用单位ms、smhdwy #设置每15s采集数据一次,默认1分钟
[ scrape_interval: <duration> | default = 1m ]
默认抓取超时
[ scrape_timeout: <duration> | default = 10s ]
估算规则的默认周期 # 每15秒计算一次规则。默认1分钟
[ evaluation_interval: <duration> | default = 1m ]
和外部系统(例如AlertManager)通信时为时间序列或者警情(Alert)强制添加的标签列表
external_labels:
[ <labelname>: <labelvalue> ... ]
规则文件列表
rule_files:
[ - <filepath_glob> ... ]
抓取配置列表
scrape_configs:
[ - <scrape_config> ... ]
Alertmanager相关配置
alerting:
alert_relabel_configs:
[ - <relabel_config> ... ]
alertmanagers:
[ - <alertmanager_config> ... ]
远程读写特性相关的配置
remote_write:
[ - <remote_write> ... ]
remote_read:
[ - <remote_read> ... ]
vi prometheus.yml
下面就是拉取自身服务采样点数据配置
scrape_configs:
别监控指标,job名称会增加到拉取到的所有采样点上,同时还有一个instance目标服务的host:port标签也会增加到采样点上
- job_name: 'prometheus'
覆盖global的采样点,拉取时间间隔5s
scrape_interval: 5s
static_configs:- targets: ['localhost:9090']
最下面,静态配置监控本机,采集本机9090端口数据
注:每次修改配置完成,用promtool检测配置文件是否正确
[root@server1 prometheus]# ./promtool check config prometheus.yml
重启服务
可以用kill -hup 进程id 自动加载新配置文件
查看targets可以看到节点正常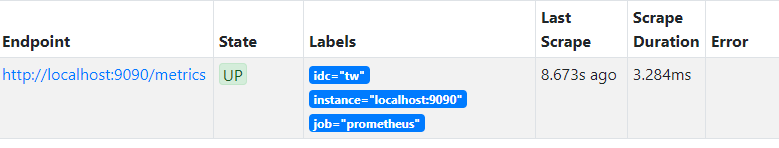
也可以在这里搜寻收集来的数据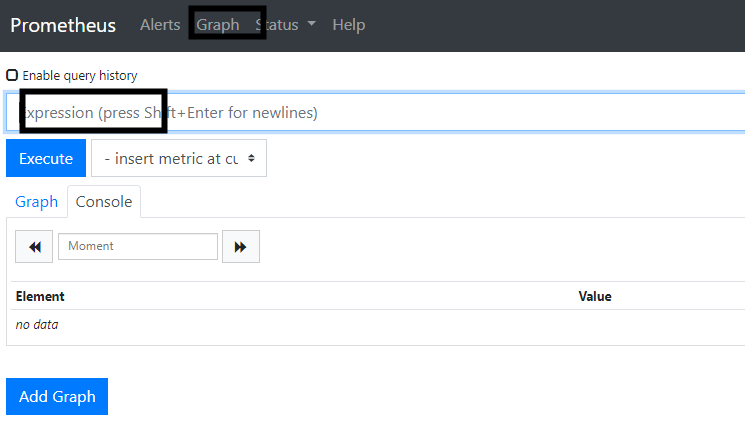
2.配置服务发现监控linux主机及相关服务
在server2 190.168.3.251上安装node_exporter
使用文档:Monitoring Linux host metrics with the Node Exporter | Prometheus
GitHub:https://github.com/prometheus/node_exporter
exporter列表:Exporters and integrations | Prometheus
在server2安装节点采集器,mysql服务,nginx服务
tar zxf node_exporter-0.17.0.linux-amd64.tar.gz
mv node_exporter-0.17.0.linux-amd64 /usr/local/node_exporter
cd /usr/local/node_exporter/
./node_exporter --help
服务发现,我们这里使用file_sd_configs,写监控配置文件,服务发现node节点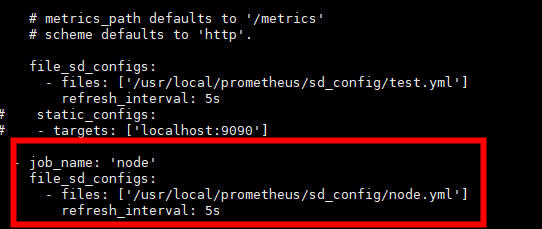
mkdir sd_config创建服务发现目录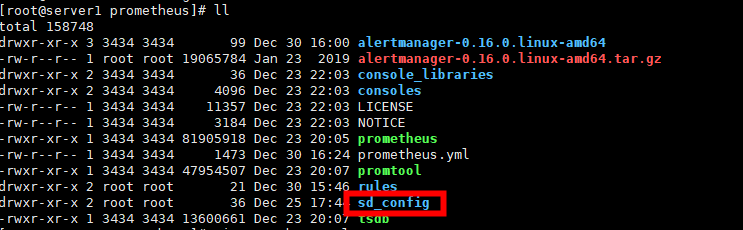
写采集地址targets
[root@server1 prometheus]# vi sd_config/node.yml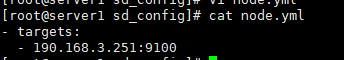
方便管理服务,将宿主机节点监控采集node_exporter加入到服务配置文件里,
vi /usr/lib/systemd/system/node_exporter.service
[Unit]
Description=https://prometheus.io
[Service]
Restart=on-failure
ExecStart=/usr/local/node_exporter/node_exporter
[Install]
WantedBy=multi-user.target
如果要监控节点的系统服务,需要在后面添加名单参数
--collector.systemd.unit-whitelist=".+" 从systemd中循环正则匹配单元
--collector.systemd.unit-whitelist="(docker|sshd|nginx).service" 白名单,收集目标
/usr/bin/node_exporter --collector.systemd --collector.systemd.unit-whitelist=(docker|sshd|nginx).service
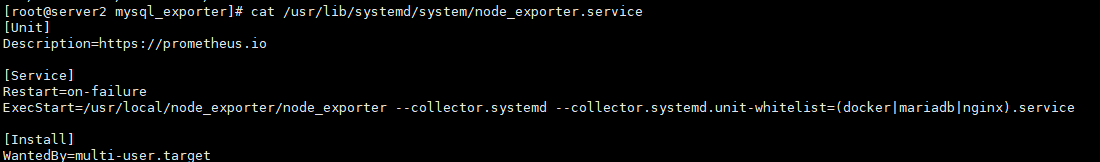
在http://190.168.3.250:9090/graph已经能看到节点采集到的宿主机信息,已经可以看到监控到了服务,值为1就是服务正常
补充:
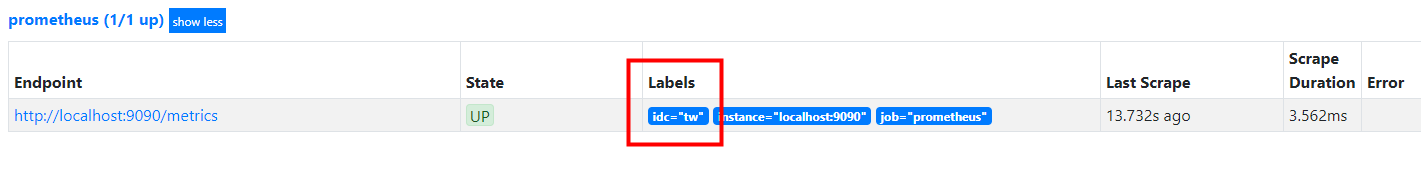
也可以将之前190.168.3.250上监控本机的9090的静态采集改成文件服务发现的形式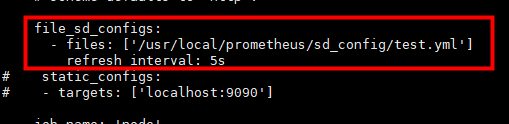
[root@server1 prometheus]# vi sd_config/test.yml ,其中的加上了标签,添加采集地址,可以在targets里使用标签查找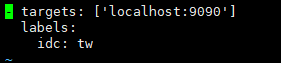
四.使用grafana前端展示数据并监控docker服务
1.cAdvisor采集容器信息
使用cAdvisor(Container Advisor)用于收集正在运行的容器资源使用和性能信息。
docker run \
--volume=/:/rootfs:ro \
--volume=/var/run:/var/run:ro \
--volume=/sys:/sys:ro \
--volume=/var/lib/docker/:/var/lib/docker:ro \
--volume=/dev/disk/:/dev/disk:ro \
--publish=8080:8080 \
--detach=true \
--name=cadvisor \
登录后复制
http://190.168.3.250:8080/访问web端口,已经采集到了容器的数据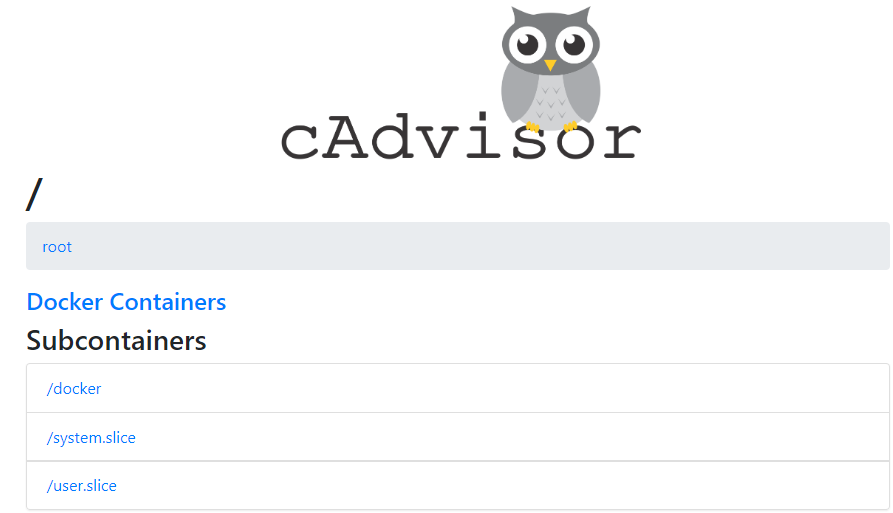
2.Grafana
Download Grafana | Grafana Labs
Grafana是一个开源的度量分析和可视化系统,Grafana支持查询普罗米修斯。自Grafana 2.5.0(2015-10-28)以来,包含了Prometheus的Grafana数据源。
在官网上下载https://grafana.com/grafana/download?platform=docker, 下载最新的rpm包,yum安装,启动服务
我们这里用的是docker版的
docker run -d --name=grafana -p 3000:3000 grafana/grafana
跑起来后,190.168.3.250:3000访问web接口
密码账号都是admin,第一次登陆需要修改密码
添加数据源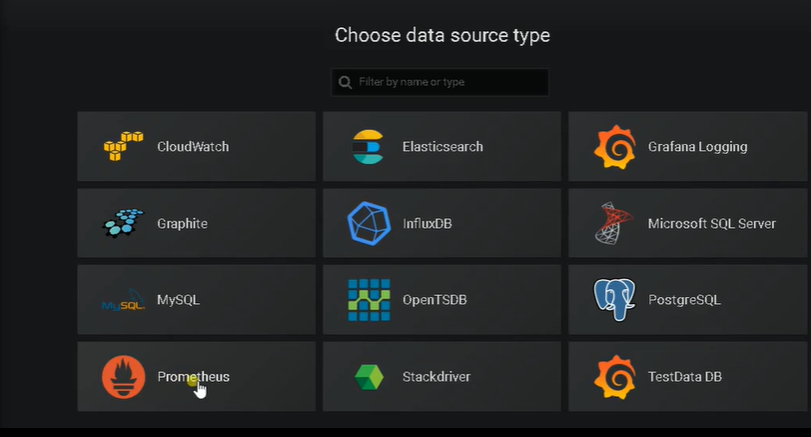
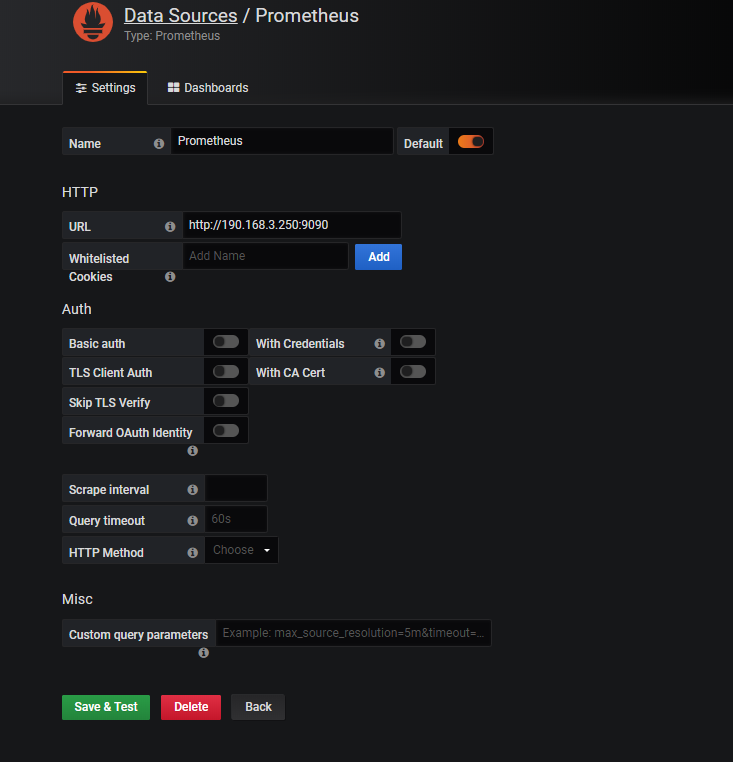
已经有一个Prometheus数据源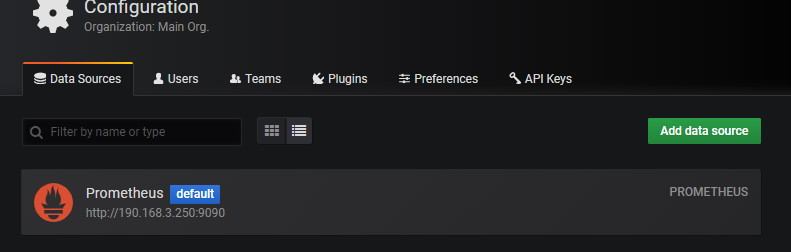
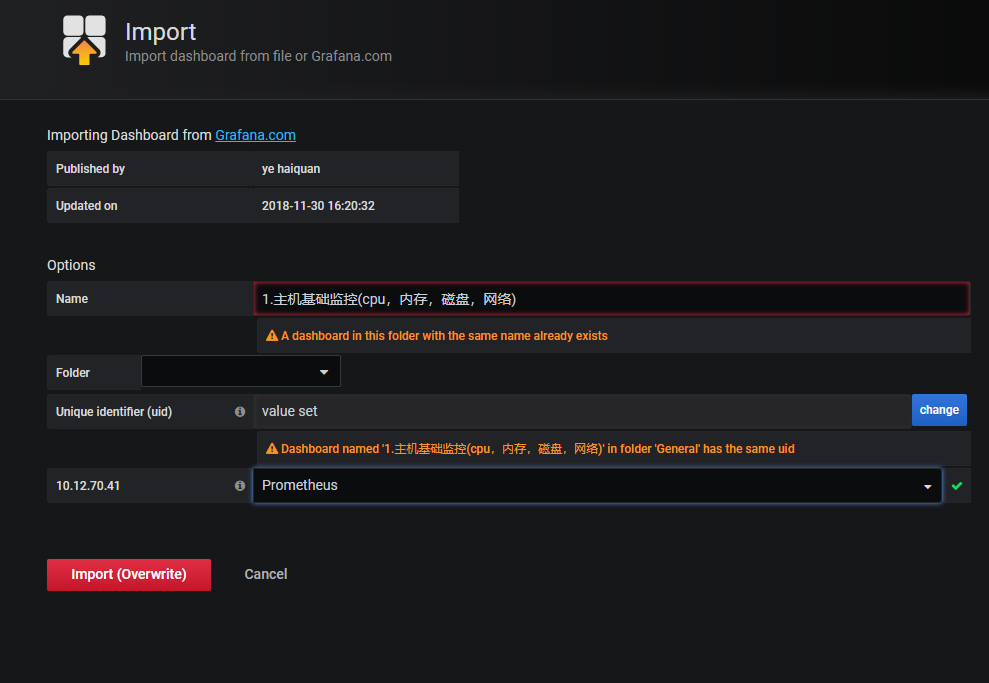
3.添加监控宿主机模板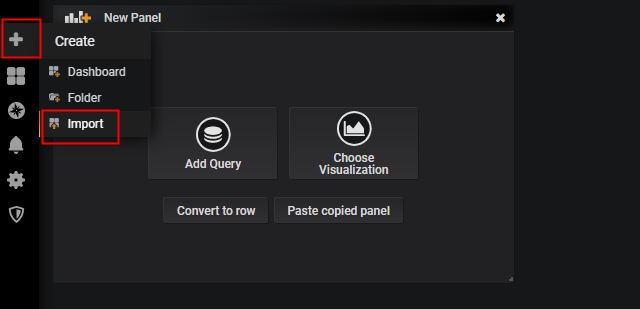
输入9276,导入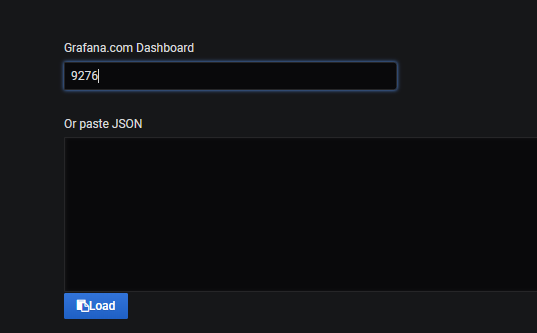
修改名字和数据库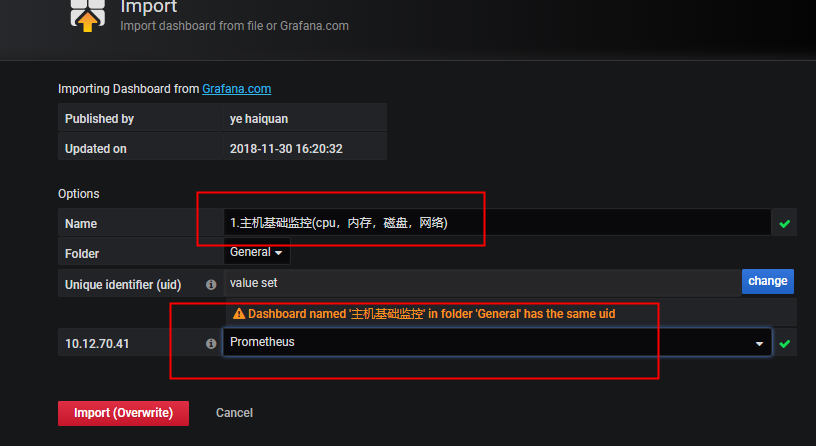
完成,查看最后模板效果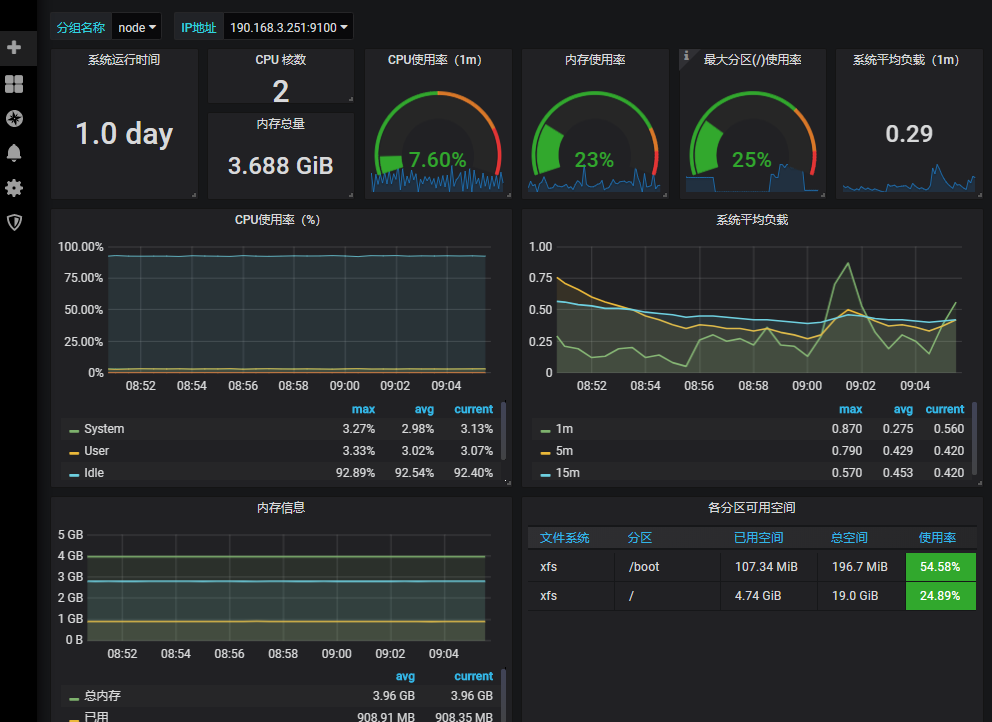
4.查看docker监控
添加新job,修改采集配置文件prometheus.yml
[root@server1 prometheus]# vi prometheus.yml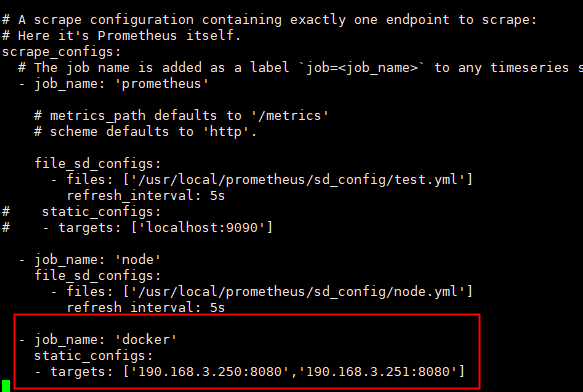
检查配置文件后,重启主服务 ./promtool check config prometheus.yml
同样方法在Grafana下载模板,导入193
也可以在https://grafana.com/dashboards/下载别的模板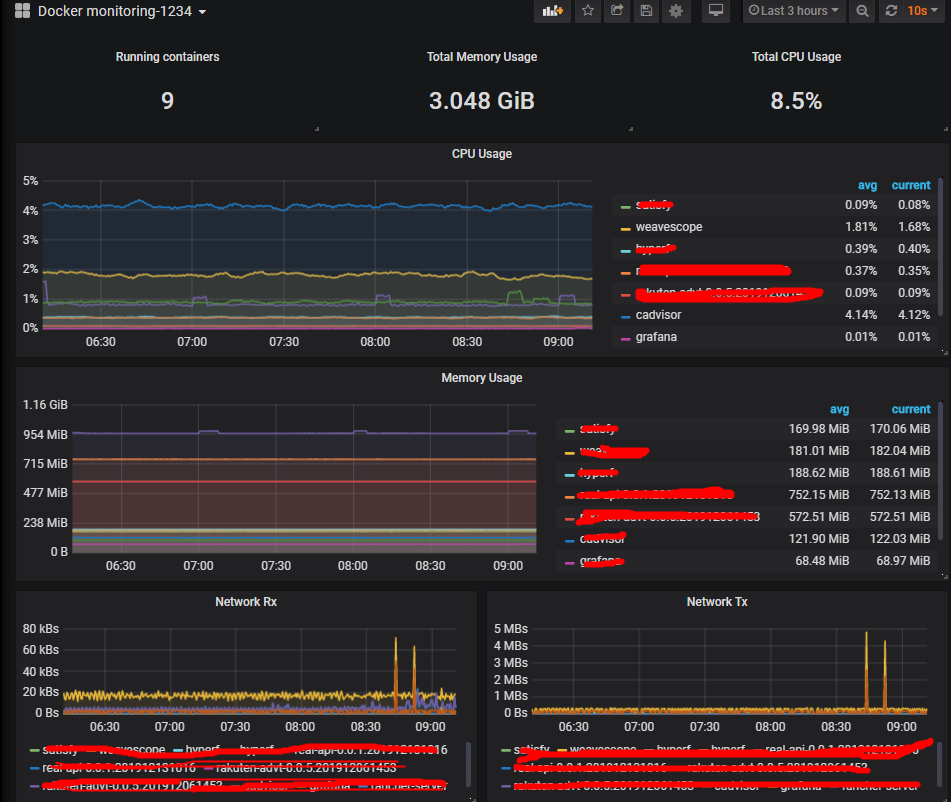
五.监控mysql服务
mysql_exporter:用于收集MySQL性能信息。
下载https://github.com/prometheus/mysqld_exporter
监控模板https://grafana.com/dashboards/7362
我们在server2 190.168.3.251上配置,需要下载mysqld_exporter数据库采集和安装mariadb
登录mysql为exporter创建账号,以便可以采集数据:
mysql> CREATE USER 'exporter'@'localhost' IDENTIFIED BY '123456';
mysql> GRANT PROCESS, REPLICATION CLIENT, SELECT ON . TO 'exporter'@'localhost';
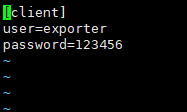
vi .my.cnf ,添加用户隐藏的数据库账号,prometheus监控mysql需要用这个账号采集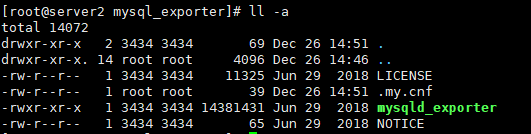
在server1 190.168.3.250修改采集配置文件
[root@server1 prometheus]# vi prometheus.yml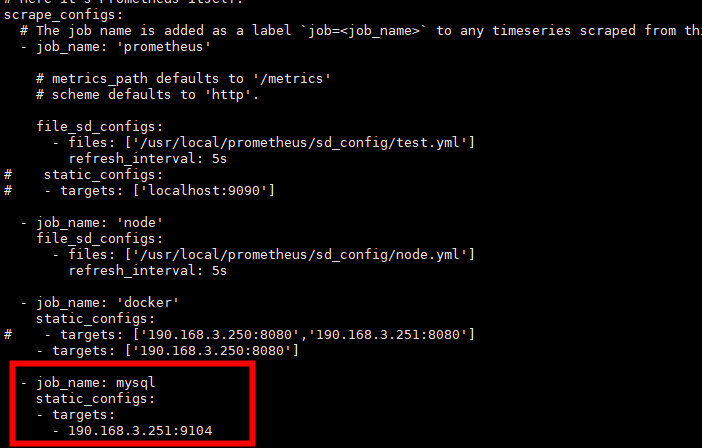
检查配置文件并重启服务,systemctl restart prometheus.service
[root@server2 mysql_exporter]# ./mysqld_exporter --config.my-cnf=.my.cnf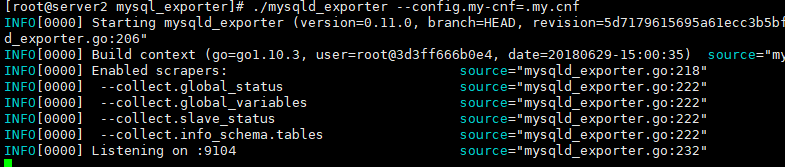
也可以写进系统服务
vi /usr/lib/systemd/system/mysqld_exporter.service
[Unit]
Description=https://prometheus.io
[Service]
Restart=on-failure
ExecStart=/usr/local/mysqld_exporter/mysqld_exporter --config.my-cnf=/usr/local/mysqld_exporter/.my.cnf
[Install]
WantedBy=multi-user.target
systemctl daemon-reload
数据库信息已经采集到了
http://190.168.3.251:9104/metrics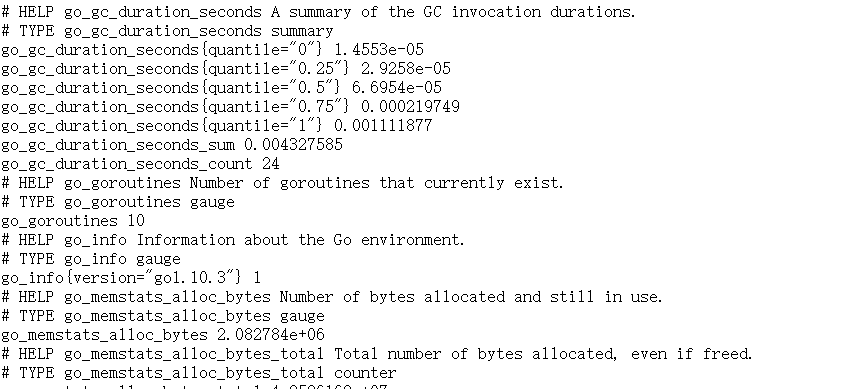
导入模板后7362后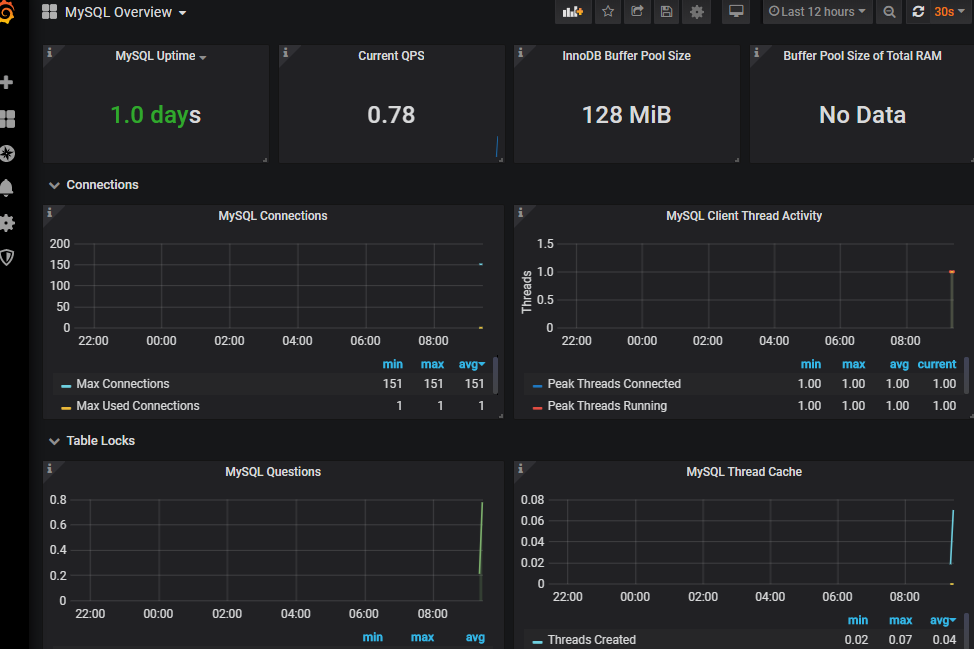
六.邮件告警
1.告警介绍
在Prometheus平台中,警报由独立的组件Alertmanager处理。通常情况下,我们首先告诉Prometheus Alertmanager所在的位置,然后在Prometheus配置中创建警报规则,最后配置Alertmanager来处理警报并发送给接收者(邮件,webhook、slack等)。
地址1:Download | Prometheus
地址2:Releases · prometheus/alertmanager · GitHub
设置告警和通知的主要步骤如下:
第一步 部署Alertmanager
第二步 配置Prometheus与Alertmanager通信
第三步 在Prometheus中创建告警规则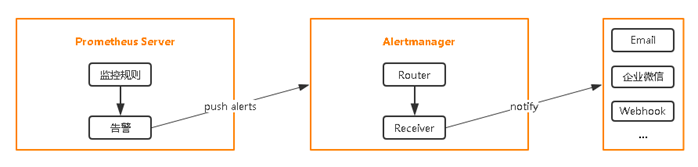
2.配置Prometheus与Alertmanager通信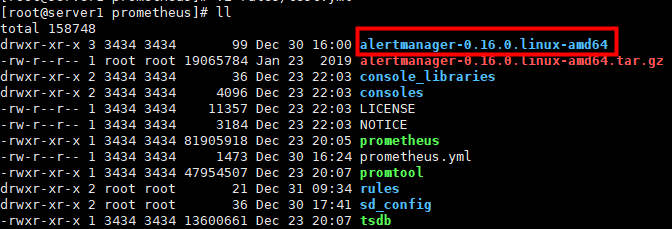
需要在官网下载以上的报警包
修改告警媒介,使用邮箱发送
[root@server1 alertmanager-0.16.0.linux-amd64]# vi alertmanager.yml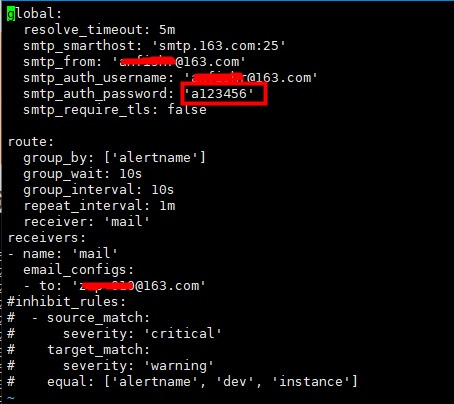
注意:上面的验证密码不是邮箱密码,是授权码
修改完检查配置文件alertmanager.yml是否正确,然后重启服务
./alertmanager --config.file alertmanager.yml
systemctl restart prometheus.service
修改prometheus连接告警模块,并设定告警规则
[root@server1 prometheus]# vi prometheus.yml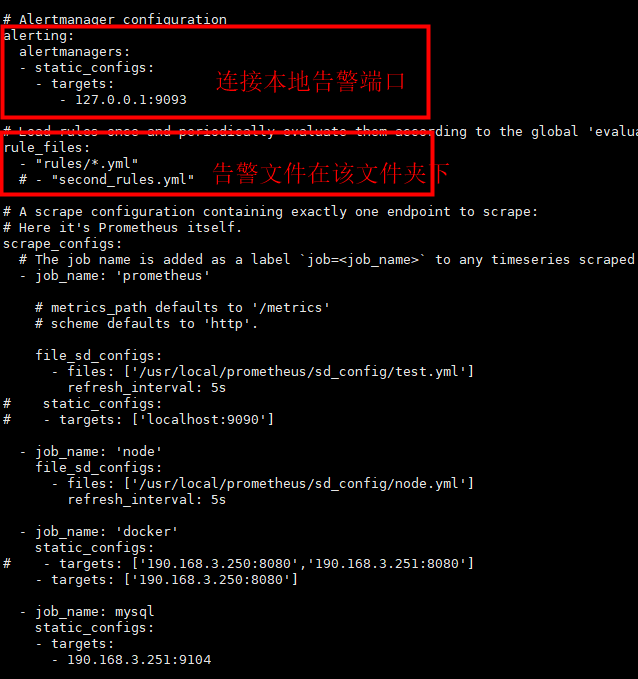
[root@server1 prometheus]# vi rules/test.yml
参照官网告警上写的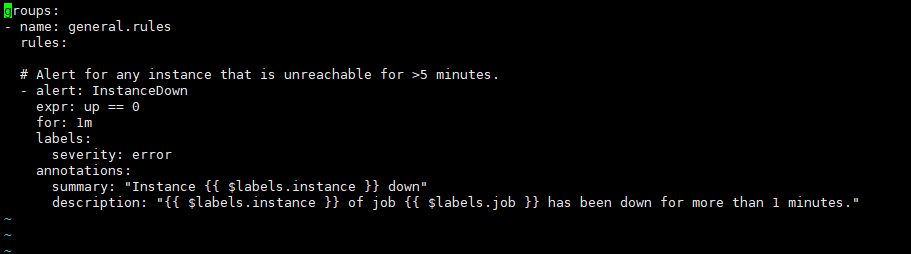
groups:
- name: example # 报警规则组名称
rules:- alert: InstanceDown
expr: up == 0
for: 1m #持续时间 , 表示持续一分钟获取不到信息,则触发报警
labels:
severity: page # 自定义标签
annotations:
summary: "Instance {{ $labels.instance }} down" # 自定义摘要
description: "{{ $labels.instance }} of job {{ $labels.job }} has been down for more than 5 minutes." # 自定义具体描述
- alert: InstanceDown
3.测试邮箱告警
我们把server2 上的mysql监控关闭,测试告警
http://190.168.3.250:9090/alerts,已经触发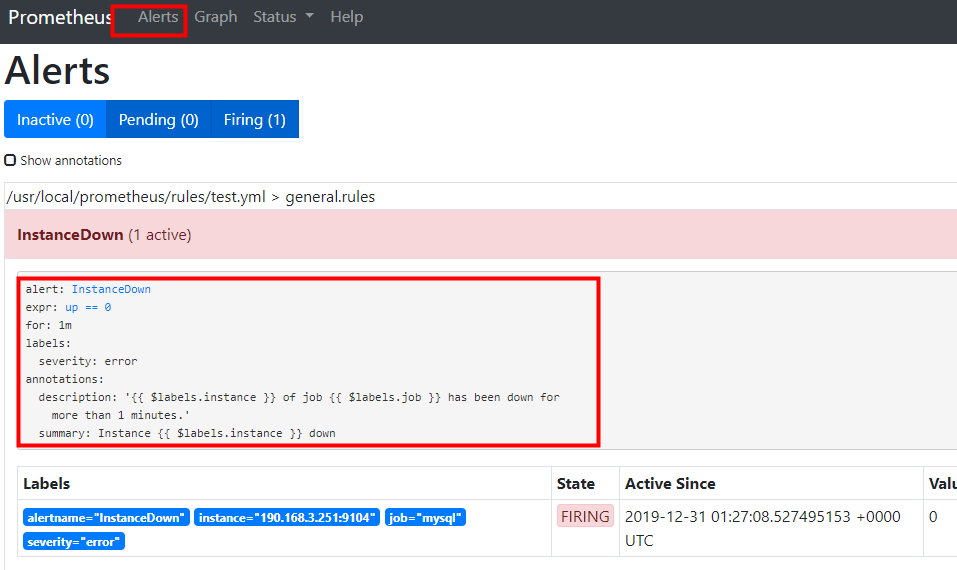
我们看邮箱,收到报警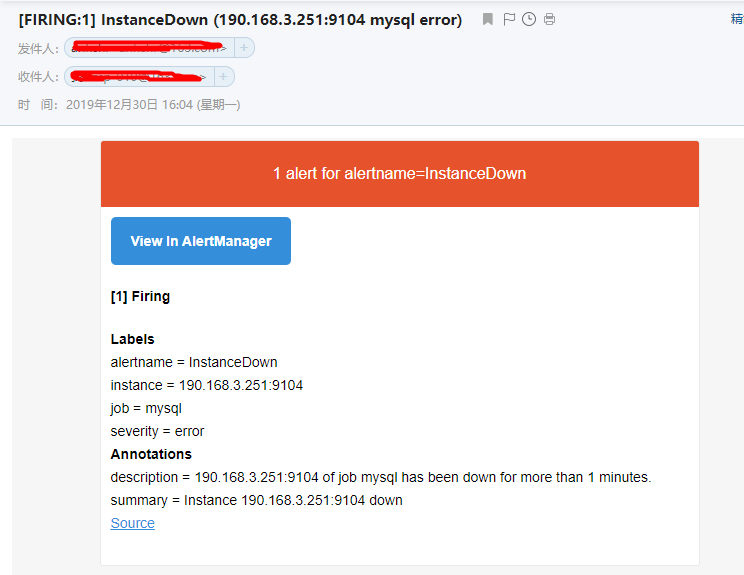
七.Prometheus完整搭建分类监控钉钉报警
1.安装环境
服务端:190.168.3.240
安装目录:/data
同步所有主机时间:ntpdate ntp1.aliyun.com
Download | Prometheus 下载最新版的组件
prometheus-2.17.1.linux-amd64.tar.gz
alertmanager-0.20.0.linux-amd64.tar.gz
prometheus-webhook-dingtalk-1.4.0.linux-amd64.tar.gz
grafana官网上下载最新版的grafana-6.7.2-1.x86_64.rpm
2.安装服务端
解压
cd /data
tar zxf prometheus-2.17.1.linux-amd64.tar.gz
mv prometheus-2.17.1.linux-amd64 prometheus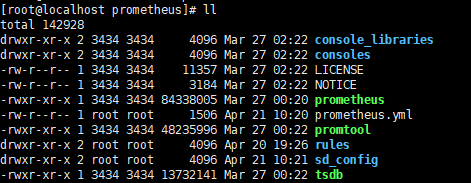
建立报警规则文件夹rules
建立服务发现节点的文件夹sd_config
vi prometheus.yml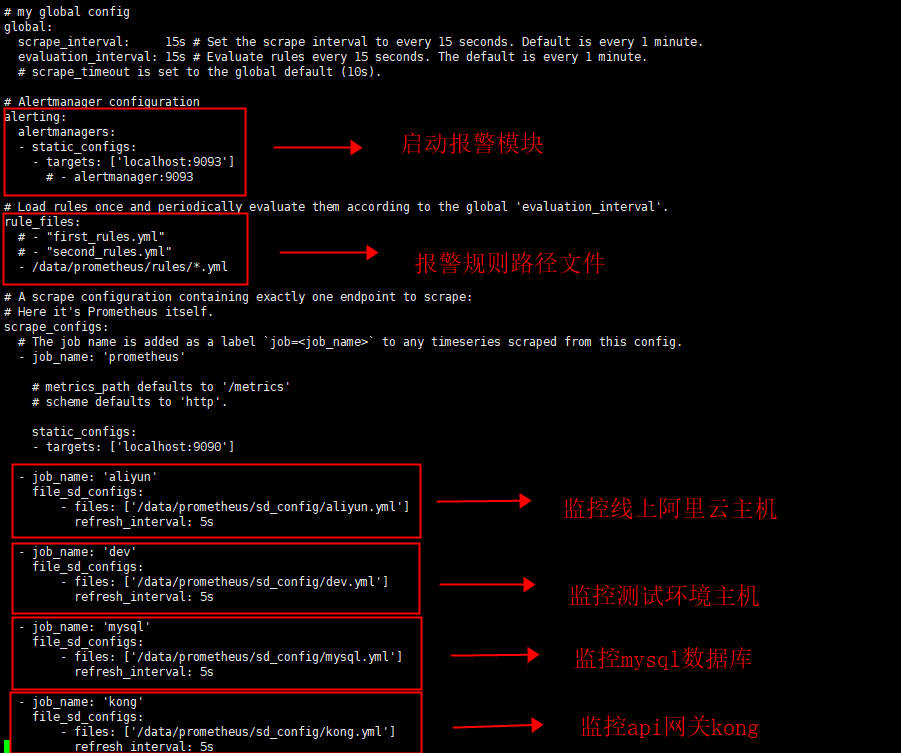
my global config
global:
my global config
global:
scrape_interval: 15s # Set the scrape interval to every 15 seconds. Default is every 1 minute.
evaluation_interval: 15s # Evaluate rules every 15 seconds. The default is every 1 minute.
scrape_timeout is set to the global default (10s).
Alertmanager configuration
alerting:
alertmanagers:
Load rules once and periodically evaluate them according to the global 'evaluation_interval'.
rule_files:
- "first_rules.yml"
- "second_rules.yml"
- /data/prometheus/rules/*.yml
A scrape configuration containing exactly one endpoint to scrape:
Here it's Prometheus itself.
scrape_configs:
The job name is added as a label job=<job_name> to any timeseries scraped from this config.
-
job_name: 'prometheus'
metrics_path defaults to '/metrics'
scheme defaults to 'http'.
static_configs:
- targets: ['localhost:9090']
-
job_name: 'aliyun'
file_sd_configs:- files: ['/data/prometheus/sd_config/aliyun.yml']
refresh_interval: 5s
- files: ['/data/prometheus/sd_config/aliyun.yml']
-
job_name: 'dev'
file_sd_configs:- files: ['/data/prometheus/sd_config/dev.yml']
refresh_interval: 5s
- files: ['/data/prometheus/sd_config/dev.yml']
-
job_name: 'mysql'
file_sd_configs:- files: ['/data/prometheus/sd_config/mysql.yml']
refresh_interval: 5s
- files: ['/data/prometheus/sd_config/mysql.yml']
- job_name: 'kong'
file_sd_configs:- files: ['/data/prometheus/sd_config/kong.yml']
refresh_interval: 5s
- files: ['/data/prometheus/sd_config/kong.yml']
3.编写节点服务发现规则sd_config
刚才我们已经在主配置文件prometheus.yml里已经写了不同的job,下面在sd_config文件夹下写上不同job的具体内容及节点标签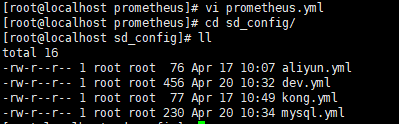
阿里云节点: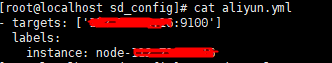
- targets: ['...:9100']
labels:
instance: node-...
测试环境节点: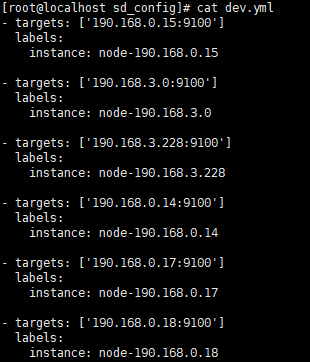
[root@localhost sd_config]# cat dev.yml
-
targets: ['190.168.0.15:9100']
labels:
instance: node-190.168.0.15 -
targets: ['190.168.3.0:9100']
labels:
instance: node-190.168.3.0 -
targets: ['190.168.3.228:9100']
labels:
instance: node-190.168.3.228 -
targets: ['190.168.0.14:9100']
labels:
instance: node-190.168.0.14 -
targets: ['190.168.0.17:9100']
labels:
instance: node-190.168.0.17 - targets: ['190.168.0.18:9100']
labels:
instance: node-190.168.0.18
测试api网关kong节点: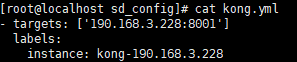
[root@localhost sd_config]# cat kong.yml
- targets: ['190.168.3.228:8001']
labels:
instance: kong-190.168.3.228
mysql数据库节点: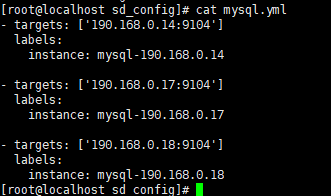
[root@localhost sd_config]# cat mysql.yml
-
targets: ['190.168.0.14:9104']
labels:
instance: mysql-190.168.0.14 -
targets: ['190.168.0.17:9104']
labels:
instance: mysql-190.168.0.17 - targets: ['190.168.0.18:9104']
labels:
instance: mysql-190.168.0.18
4.编写报警规则
建立报警规则文件夹rules,在里面写上不同的告警规则,里面有cpu报警,磁盘报警,内存报警,节点状态报警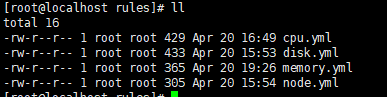
名词解释:
name: 告警名称
expr:表达式
for: 持续时间
[root@localhost rules]# cat cpu.yml
groups:
- name: cpu_rule
rules:- alert: "CPU使用率过高"
expr: round(100 - ((avg by (instance,job)(irate(node_cpu_seconds_total{mode="idle",instance!~'bac-.'}[5m]))) 100)) > 90
for: 2m
labels:
severity: warning
annotations:
summary: "{{$labels.instance}}:CPU使用率大于90%"
description: "{{$labels.instance}}:当前使用率{{ $value }}%"
- alert: "CPU使用率过高"
[root@localhost rules]# cat disk.yml
groups:
- name: disk_rule
rules:- alert: "磁盘使用率过高"
expr: round(100-100*(node_filesystem_avail_bytes{fstype=~"ext4|xfs"} / node_filesystem_size_bytes{fstype=~"ext4|xfs"})) > 85
for: 2m
labels:
severity: warning
annotations:
summary: "磁盘使用率过高大于85%"
description: "当前磁盘{{$labels.mountpoint}} 使用率{{ $value }}%"
- alert: "磁盘使用率过高"
[root@localhost rules]# cat memory.yml
groups:
- name: memory_rule
rules:- alert: "内存使用率过高"
expr: round(100- node_memory_MemAvailable_bytes/node_memory_MemTotal_bytes*100) > 90
for: 2m
labels:
severity: warning
annotations:
summary: "内存使用率过高大于90%"
description: "当前使用率{{ $value }}%"
- alert: "内存使用率过高"
[root@localhost rules]# cat node.yml
groups:
- name: node_rule
rules:- alert: 节点状态
expr: up == 0
for: 2m
labels:
status: warning
annotations:
summary: "{{$labels.instance}}:服务器节点关闭"
description: "{{$labels.instance}}:服务器节点关闭"
- alert: 节点状态
5.写完后检查配置文件是否正确
[root@localhost prometheus]# ./promtool check config prometheus.yml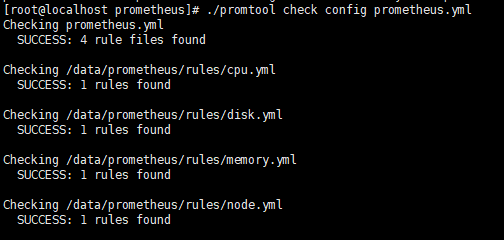
6.编写prometheus启动服务和安装grafana
vi /usr/lib/systemd/system/prometheus.service
[Unit]
Description=https://prometheus.io
[Service]
Restart=on-failure
ExecStart=/data/prometheus/prometheus --config.file=/data/prometheus/prometheus.yml
[Install]
WantedBy=multi-user.target
systemctl daemon-reload
systemctl start prometheus.service
systemctl enable prometheus.service
安装grafana
yum install -y grafana-6.7.2-1.x86_64.rpm
systemctl start grafana-server.service
systemctl enable grafana-server.service
启动服务
7.安装alertmanager告警模块
cd /data
tar zxf prometheus-2.17.1.linux-amd64.tar.gz
mv prometheus-2.17.1.linux-amd64 prometheus
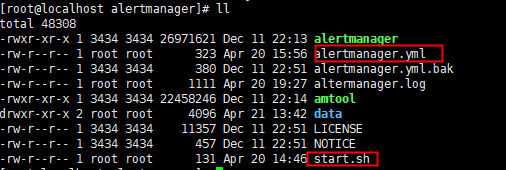
我们备份下配置文件,写一个启动脚本
名词解释:
当一个新的报警分组被创建后,需要等待至少group_wait时间来初始化通知,这种方式可以确保您能有足够的时间为同一分组来获取多个警报,然后一起触发这个报警信息。
group_wait: 30s
当第一个报警发送后,等待'group_interval'时间来发送新的一组报警信息。
group_interval: 5m
如果一个报警信息已经发送成功了,等待'repeat_interval'时间来重新发送他们
repeat_interval: 5m
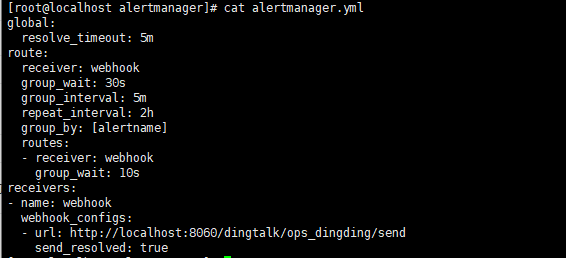
[root@localhost alertmanager]# cat alertmanager.yml
global:
resolve_timeout: 5m
route:
receiver: webhook
group_wait: 30s
group_interval: 5m
repeat_interval: 2h
group_by: [alertname]
routes:
- receiver: webhook
group_wait: 10s
receivers:- name: webhook
webhook_configs:
- name: webhook
- url: http://localhost:8060/dingtalk/ops_dingding/send
send_resolved: true
发送到本机钉钉的webhook
检测配置文件是否正确
[root@localhost alertmanager]# ./amtool check-config alertmanager.yml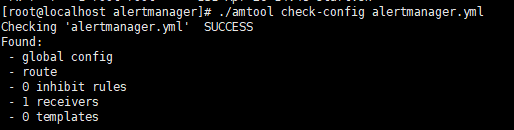
启动脚本启动服务
[root@localhost alertmanager]# cat start.sh
#!/bin/bash
nohup ./alertmanager --config.file=alertmanager.yml --cluster.advertise-address=0.0.0.0:9093 2>&1 1>altermanager.log &
netstat -antple | grep 9093
8.将钉钉接入 Prometheus AlertManager WebHook
插件下载地址:GitHub - timonwong/prometheus-webhook-dingtalk: DingTalk integration for Prometheus Alertmanager
cd /data
tar zxf prometheus-webhook-dingtalk-1.4.0.linux-amd64.tar.gz
mv prometheus-webhook-dingtalk-1.4.0.linux-amd64 prometheus-webhook-dingtalk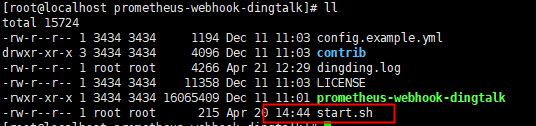
启动脚本启动服务
[root@localhost prometheus-webhook-dingtalk]# cat start.sh
#!/bin/bash
nohup ./prometheus-webhook-dingtalk --ding.profile="ops_dingding=https://oapi.dingtalk.com/robot/send?access_token=039b3fd212f6c45f12c3dc1fdbf8584b033cb7dc2afb61c0cb7091d95f2c68e4" 2>&1 1>dingding.log &
netstat -antple | grep 8060
9.创建钉钉机器人
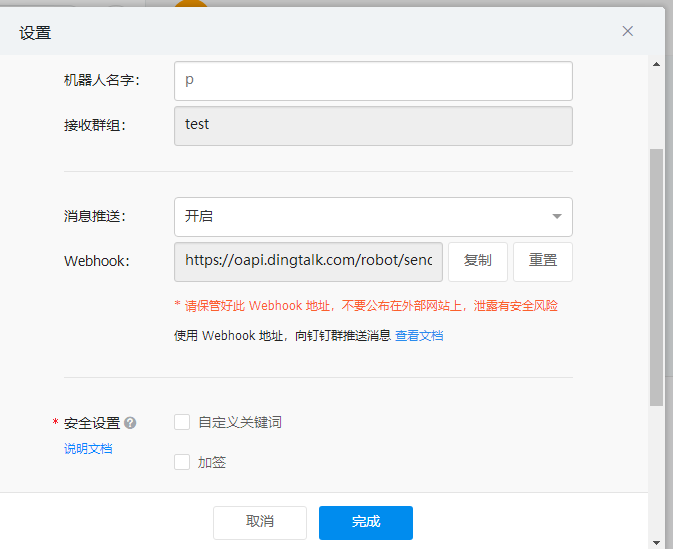
测试钉钉webhook机器人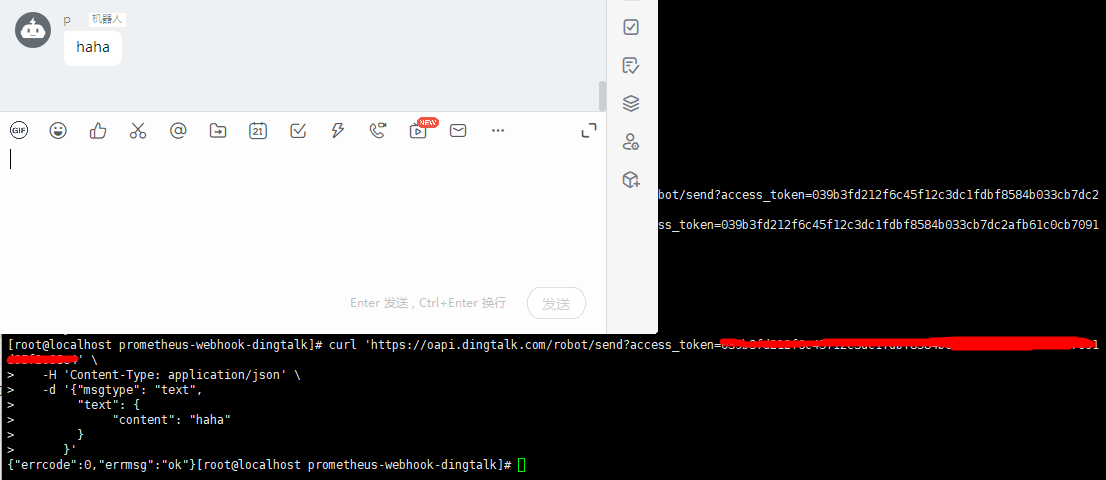
启动服务
[root@localhost prometheus-webhook-dingtalk]# cat start.sh
#!/bin/bash
nohup ./prometheus-webhook-dingtalk --ding.profile="ops_dingding=https://oapi.dingtalk.com/robot/send?access_token=**" 2>&1 1>dingding.log &
netstat -antple | grep 8060
10.安装各个节点的node_exporter
在190.168.0.15上举例安装node_exporter
cd /data
tar zxf node_exporter-0.18.1.linux-amd64.tar.gz
mv node_exporter-0.18.1.linux-amd64 node_exporter
cd node_exporter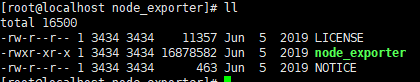
添加到服务里面
vi /usr/lib/systemd/system/node_exporter.service
[Unit]
Description=https://prometheus.io
[Service]
Restart=on-failure
ExecStart=/data/node_exporter/node_exporter
[Install]
WantedBy=multi-user.target
systemctl daemon-reload
systemctl start node_exporter.service
systemctl enable node_exporter.service
netstat -antple | grep 9100
剩下5个节点按照sd_config节点发现的dev配置依次按照190.168.0.15的节点添加方法全部安装node_exporter并启动
11.安装mysqld_exporter节点采集
这里拿190.168.0.14举例安装mysqld_exporter
cd /data
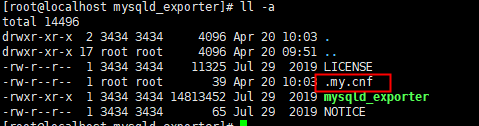
tar zxf mysqld_exporter-0.12.1.linux-amd64.tar.gz
mv mysqld_exporter-0.12.1.linux-amd64 mysqld_exporter
mysqld_exporter采集账户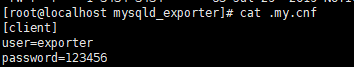
登录数据库创建用户exporter
CREATE USER 'exporter'@'localhost' IDENTIFIED BY '123456';
GRANT PROCESS, REPLICATION CLIENT, SELECT ON . TO 'exporter'@'localhost';
将mysqld_exporter添加到服务管理里
vi /usr/lib/systemd/system/mysqld_exporter.service
[Unit]
Description=https://prometheus.io
[Service]
Restart=on-failure
ExecStart=/data/mysqld_exporter/mysqld_exporter --config.my-cnf=/data/mysqld_exporter/.my.cnf
[Install]
WantedBy=multi-user.target
systemctl daemon-reload
systemctl start mysqld_exporter.service
systemctl enable mysqld_exporter.service
netstat -antple | grep 9104
剩下2个节点按照sd_config节点发现的mysql配置依次按照190.168.0.14的节点添加方法全部安装mysqld_exporter并启动
12.线上阿里云节点的node_exporter和测试环境dev的方法一样
13.登录prometheus自带web界面
http://190.168.3.240:9090/
查看状态目标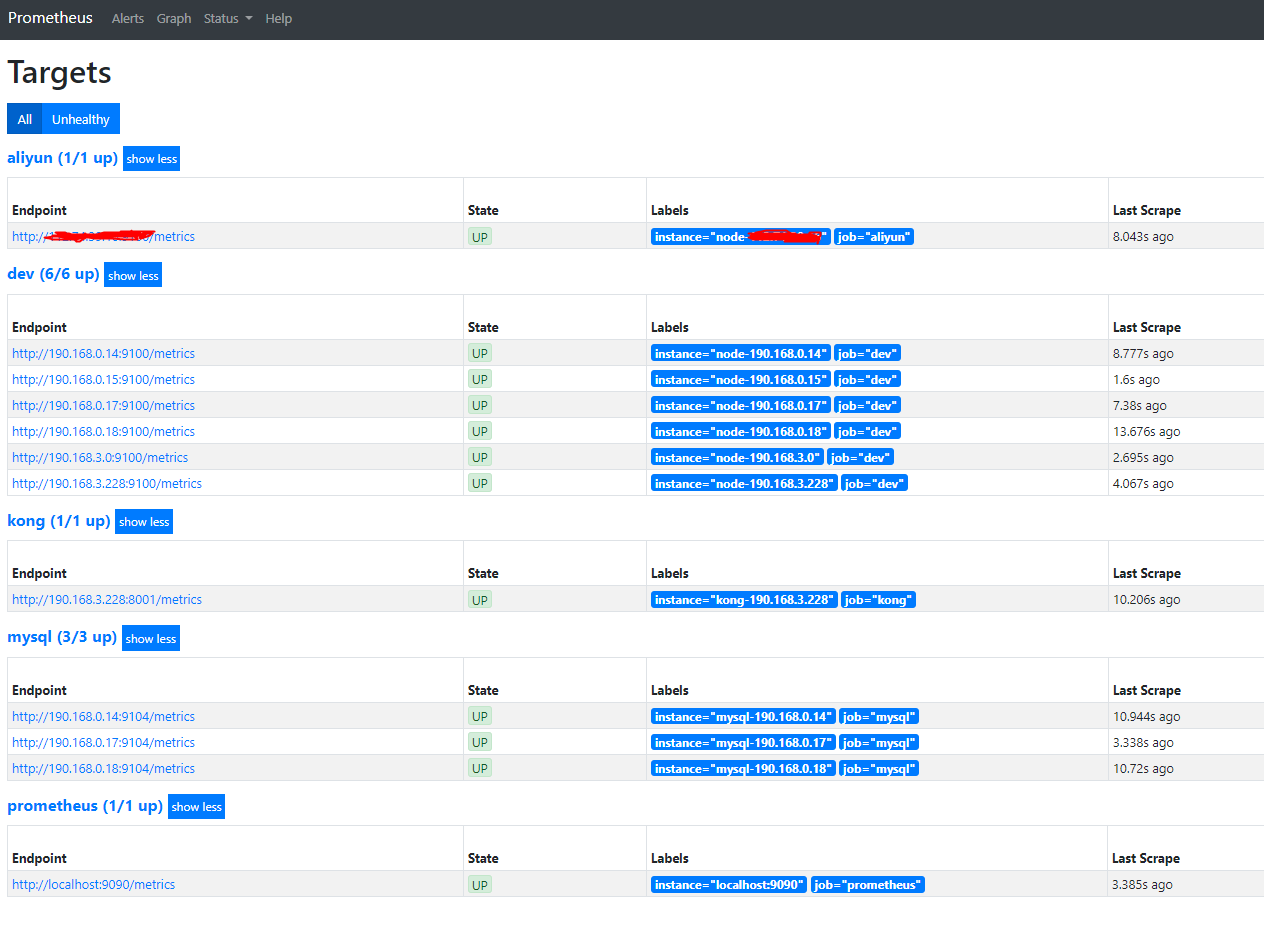
查看告警规则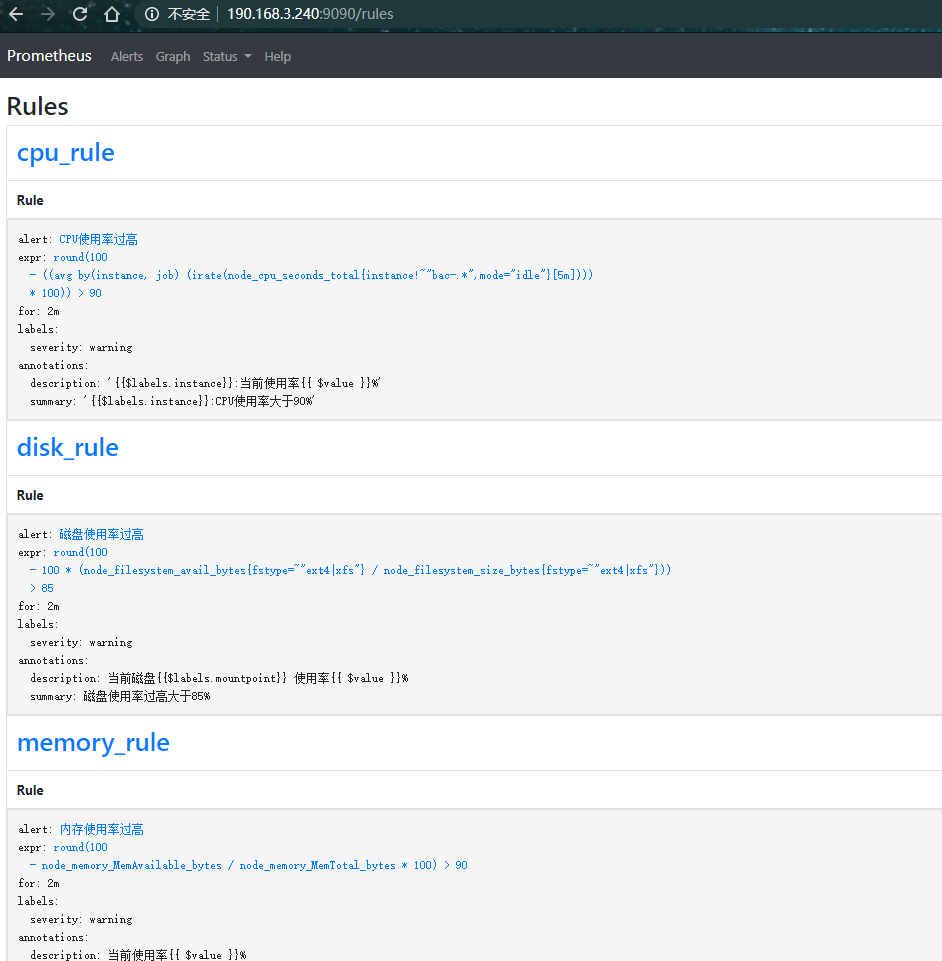
查看服务发现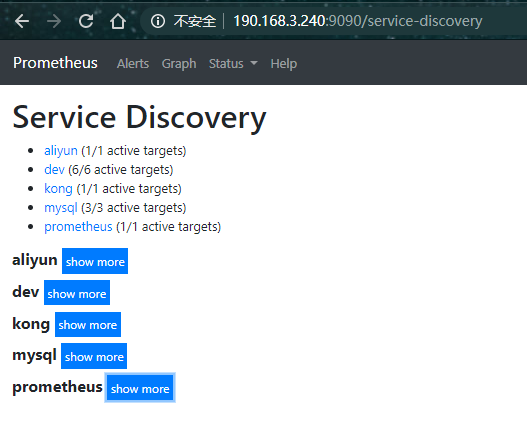
查看测试expr界面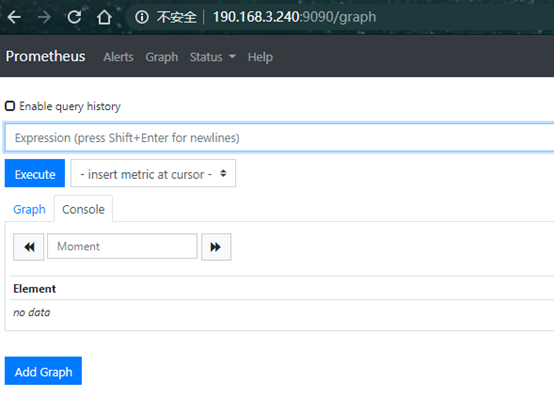
14.登录grafana的web界面
190.168.3.240:3000
账号密码admin,进入后修改密码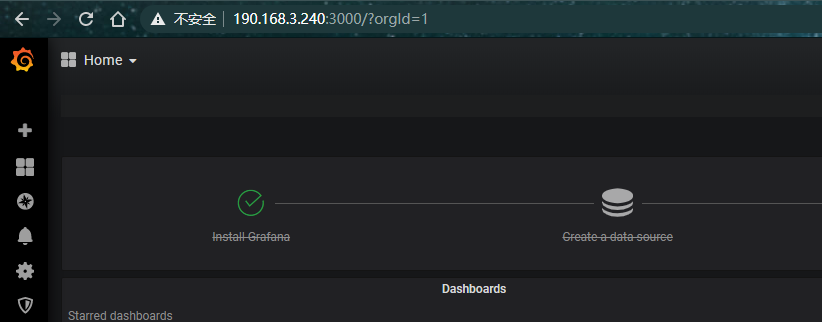
添加prometheus数据源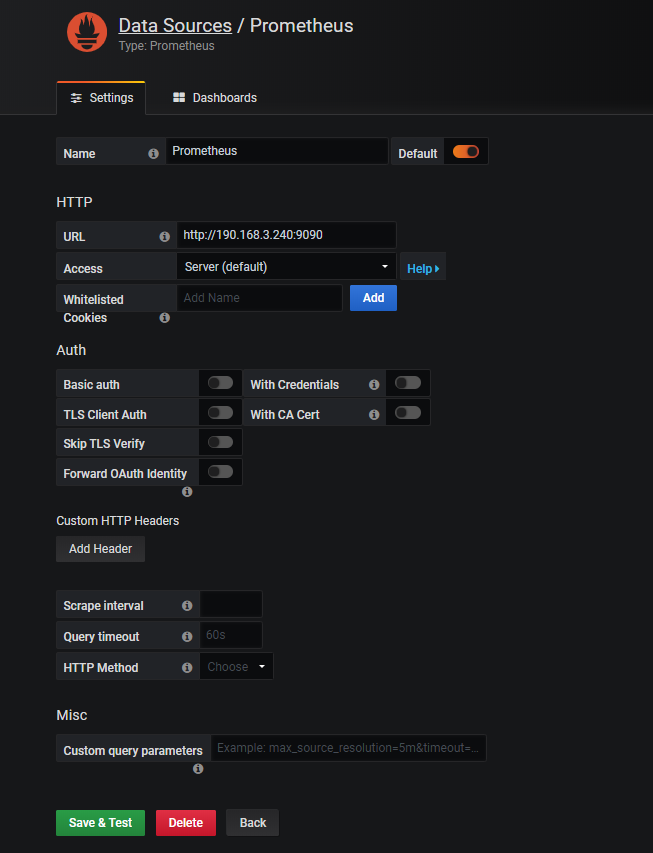
15.添加node监控模板
模板可以到grafana官方网站下载,选好模板,进去将id复制下来
Dashboards | Grafana Labs
导入模板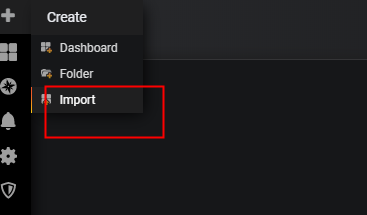
我们这里的监控主机参数用的是9276模板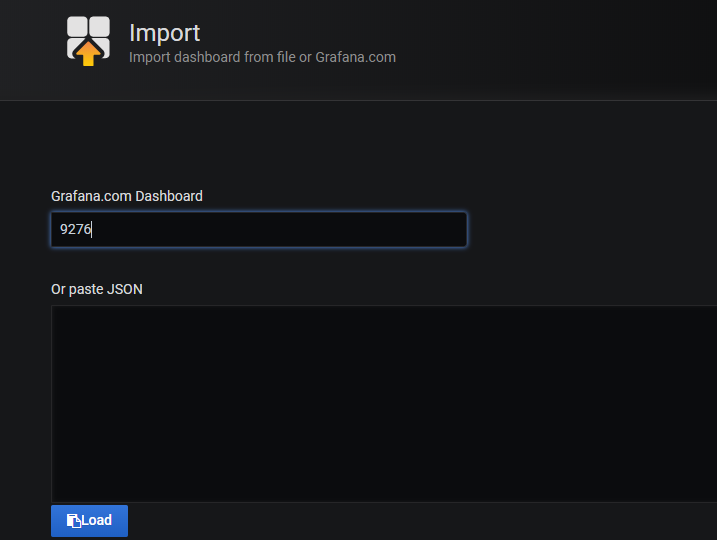
查看模板结果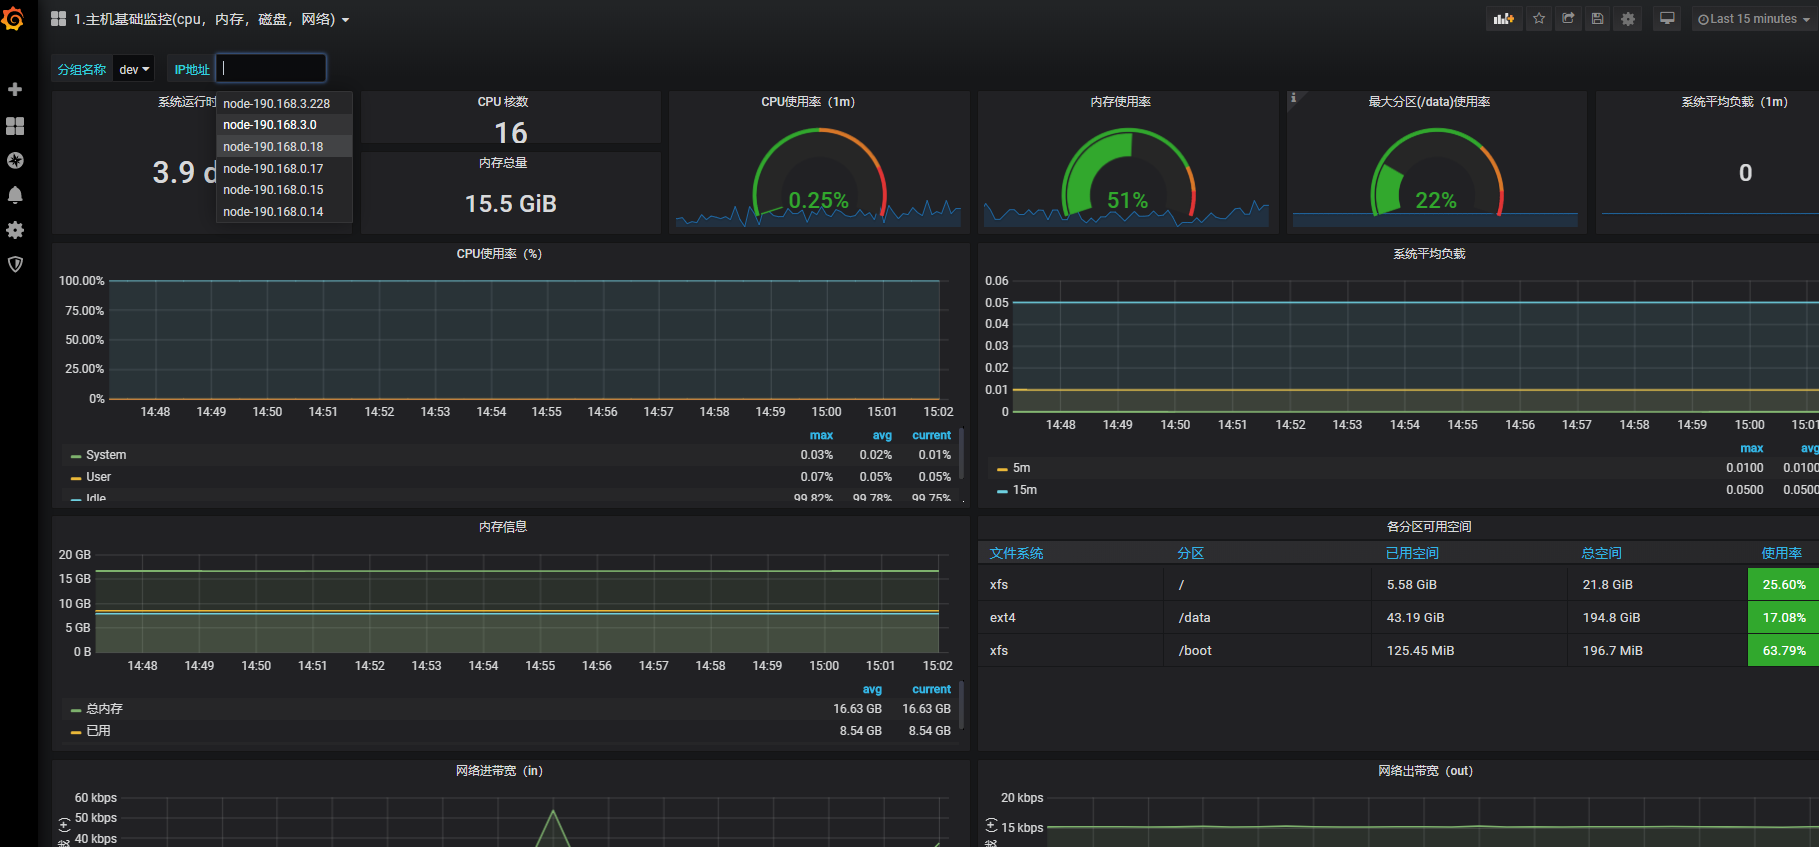
16.添加mysqld_exporter监控模板
同样方法导入7362模板
查看模板结果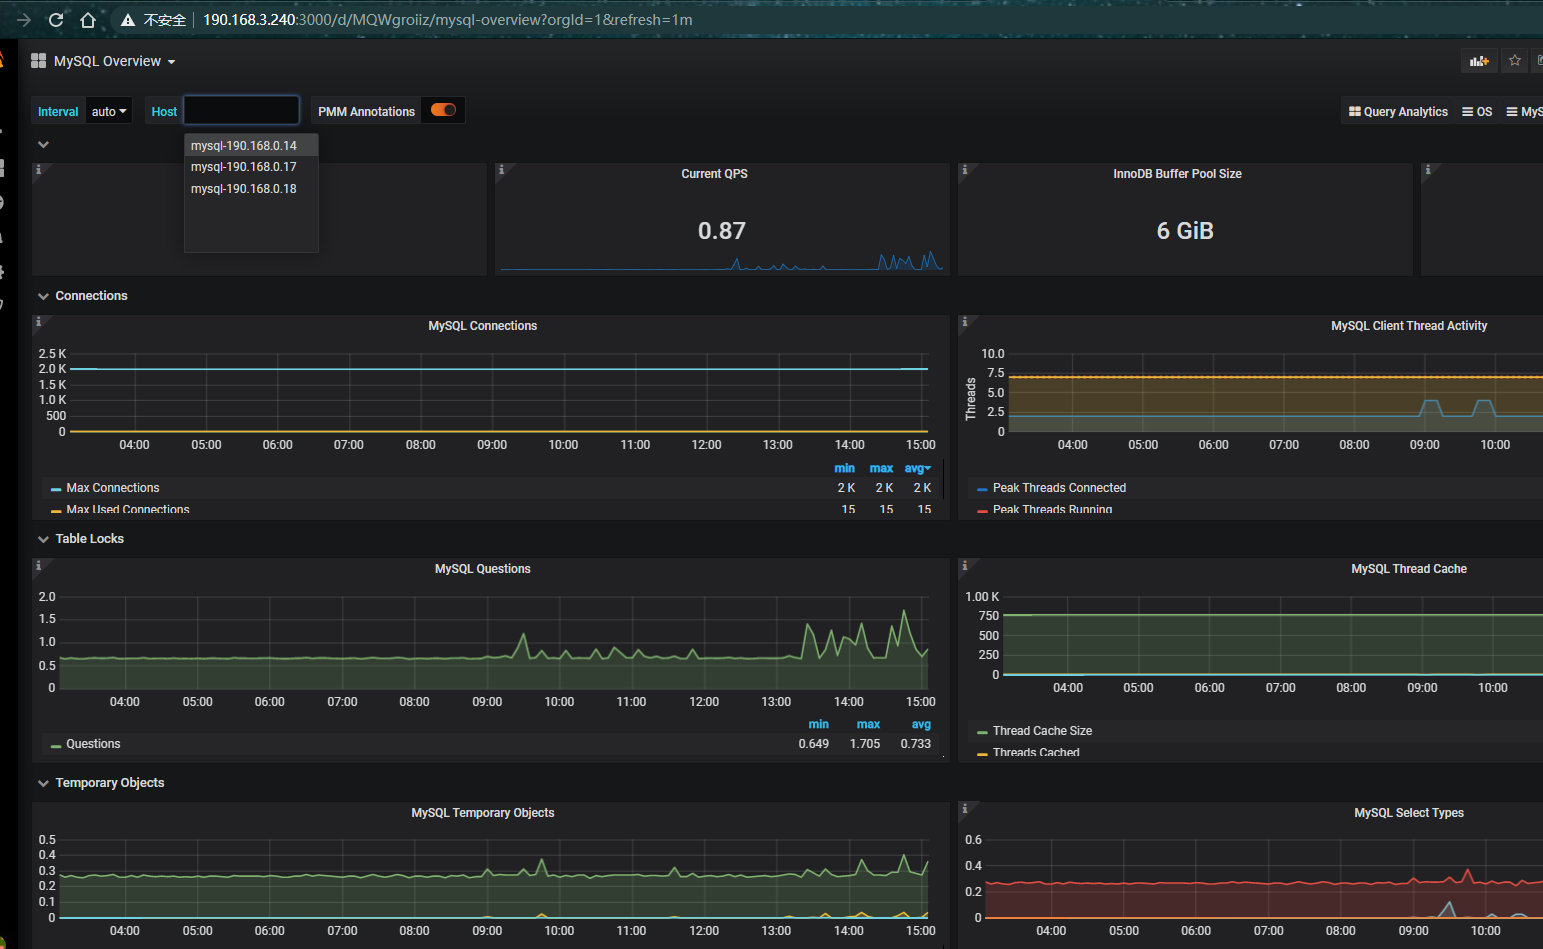
17.测试钉钉报警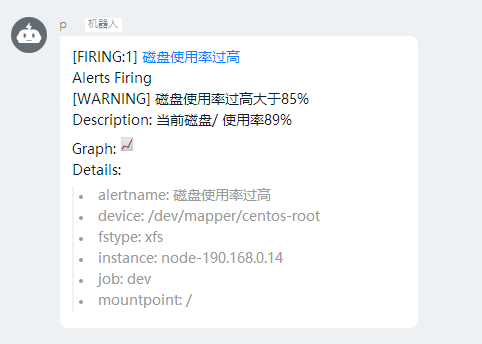
18.自己编写模板
写一个测试环境所有主机cpu,内存,数据盘总览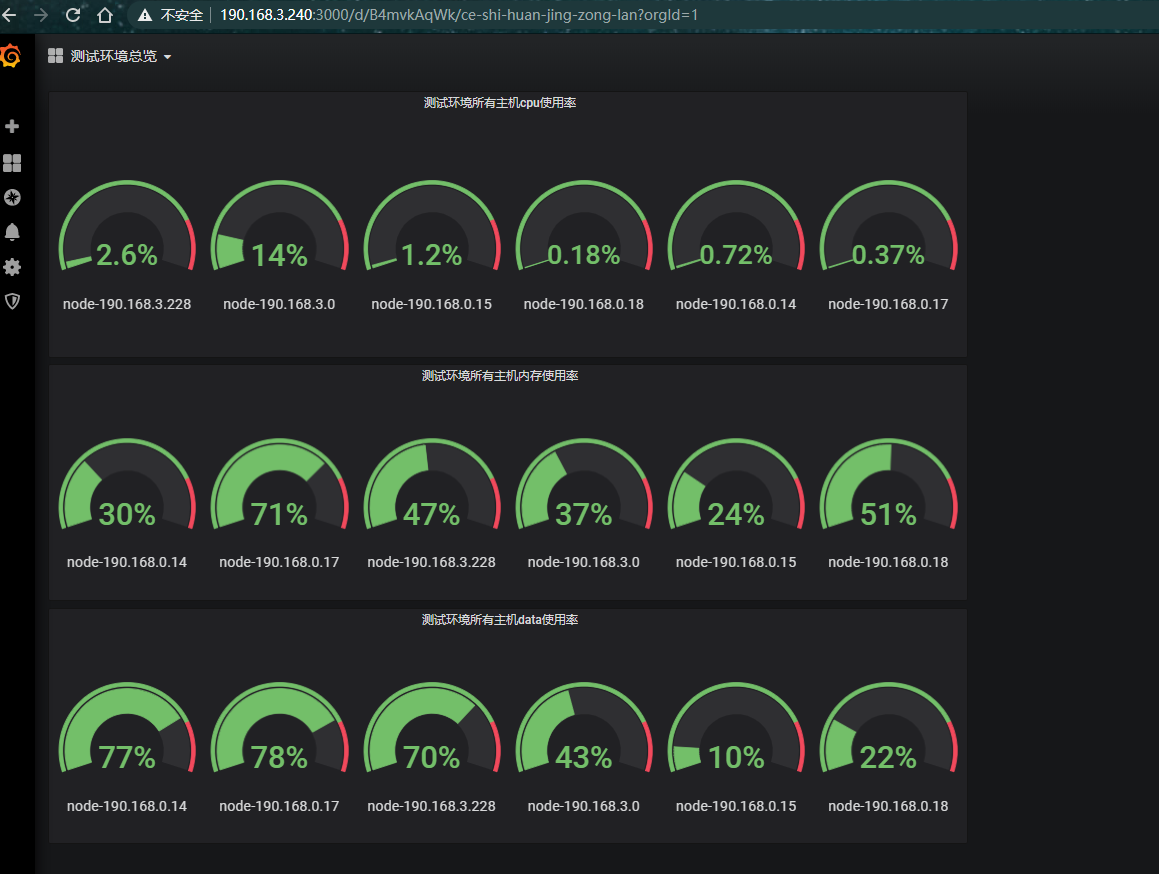
查看cpu表达式(1-((sum(increase(node_cpu_seconds_total{mode="idle",job="dev"}[1m])) by (instance)) /(sum(increase(node_cpu_seconds_total[1m])) by (instance)))) * 100
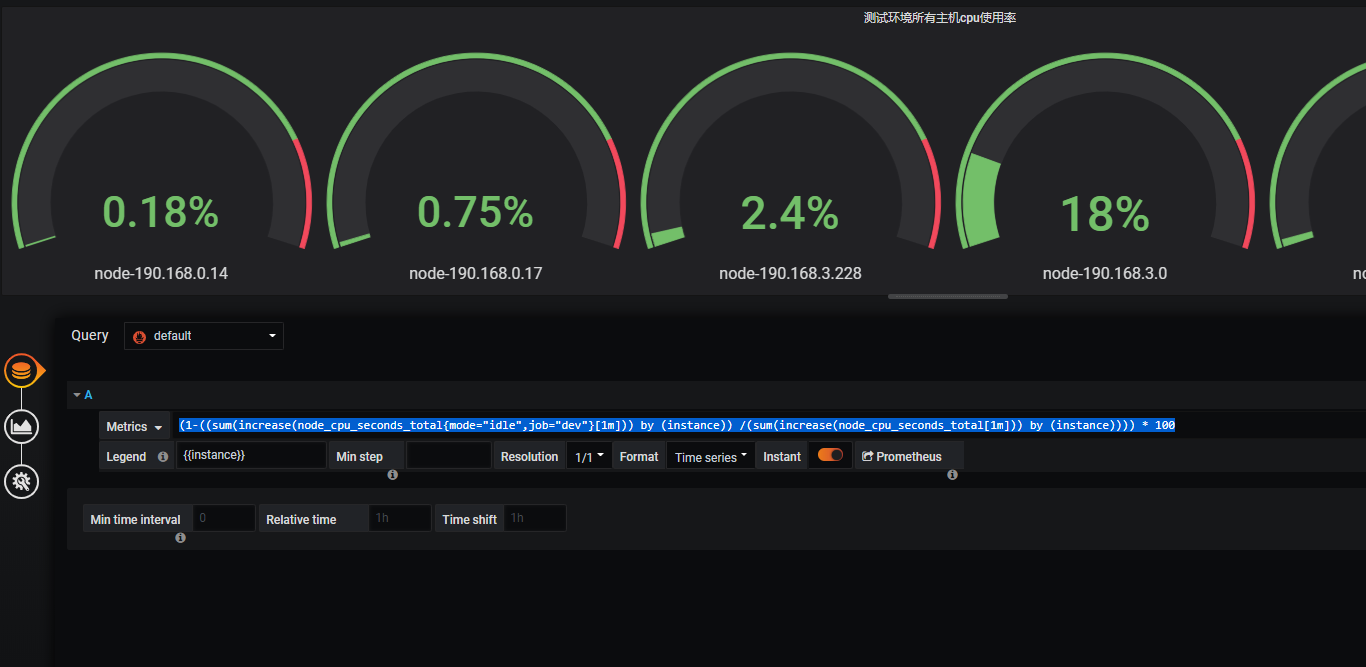
选择图形和百分比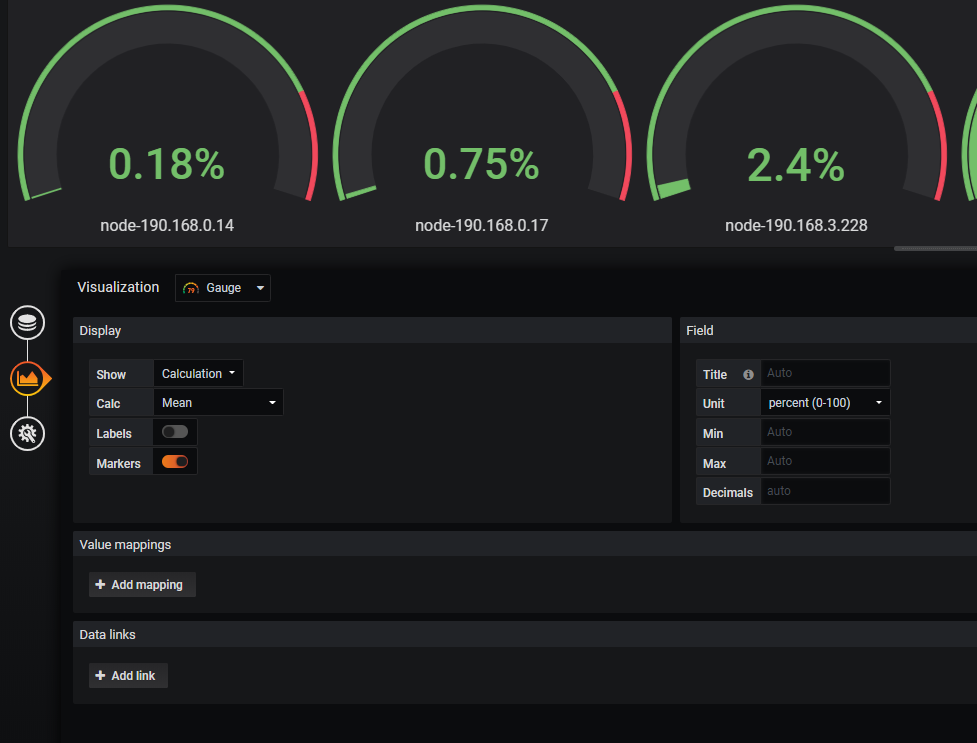
查看内存表达式round((node_memory_MemTotal_bytes{job="dev"}-(node_memory_MemFree_bytes+node_memory_Buffers_bytes+node_memory_Cached_bytes))/node_memory_MemTotal_bytes * 100)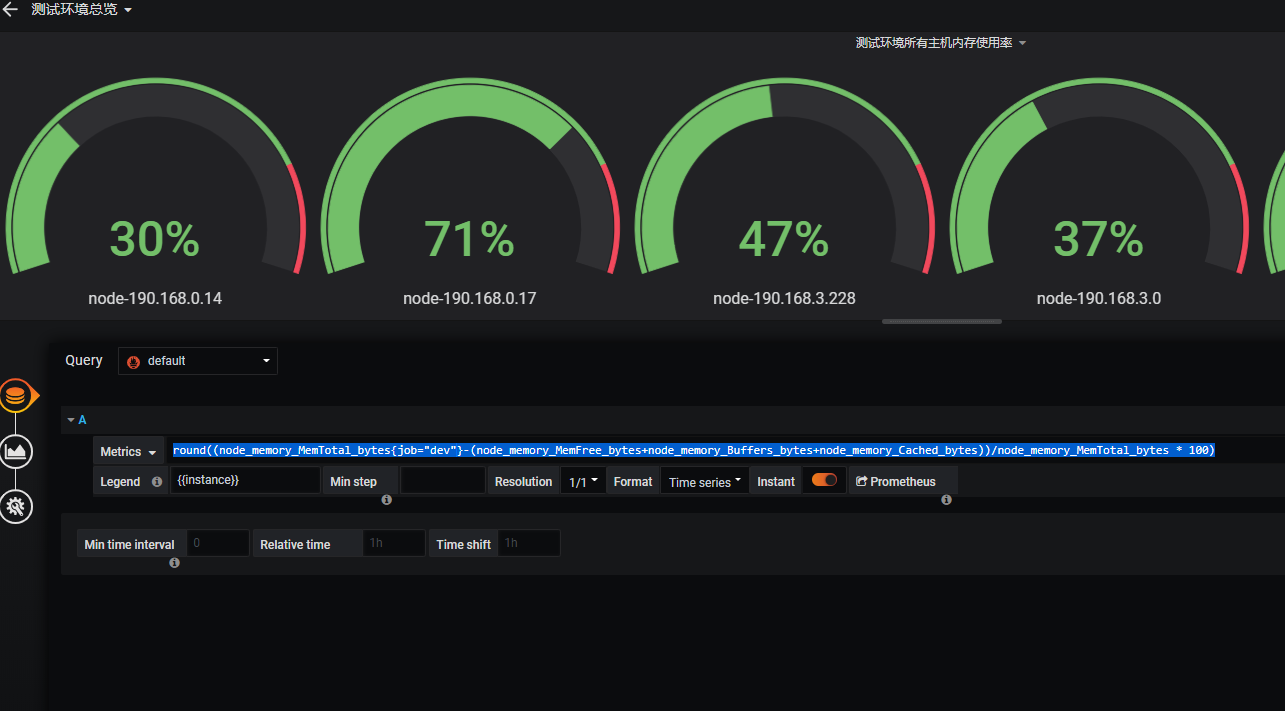
查看数据盘表达式round(100-100*(node_filesystem_avail_bytes{job="dev",fstype=~"ext4|xfs",mountpoint="/data"} / node_filesystem_size_bytes{job="dev",fstype=~"ext4|xfs",mountpoint="/data"}))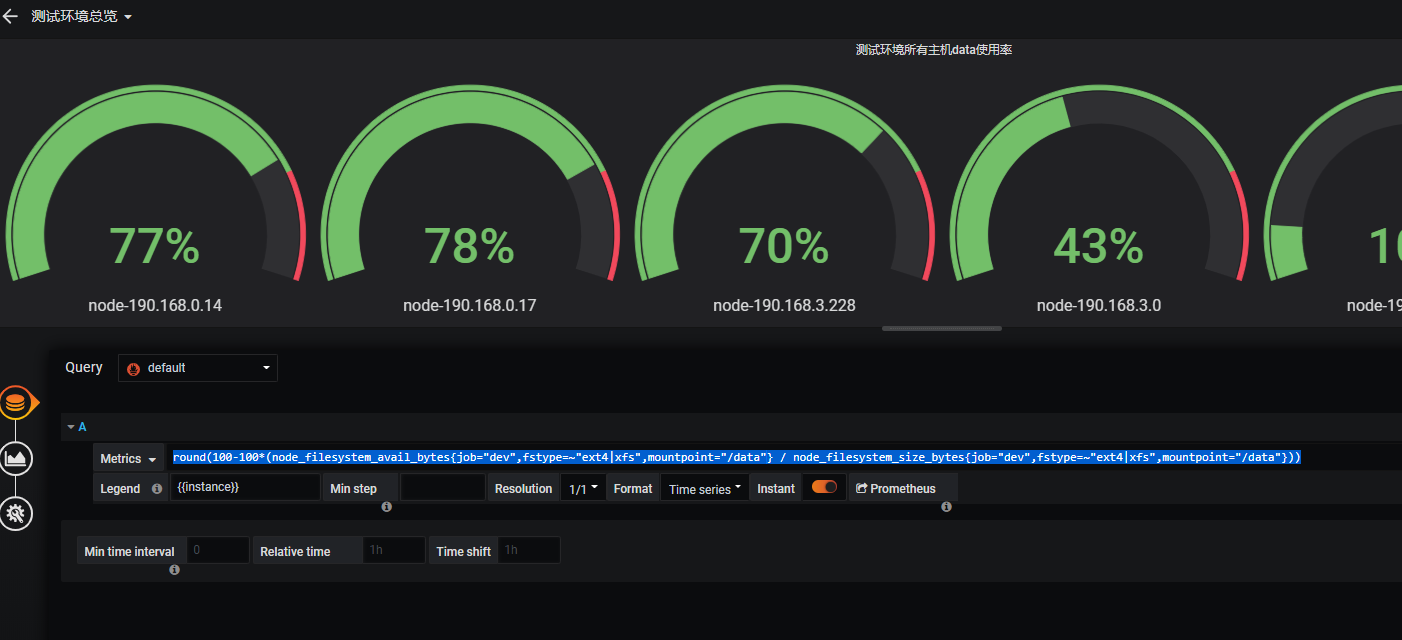
监控rule参考
prometheus linux系统告警规则 实例 - Elvin-vip - 博客园
测试expr
网卡
irate(node_network_receive_bytes_total{instance=~'$node',device=~'$nic'}[5m])8
irate(node_network_receive_bytes_total{instance=~'$node',device!~'tap.|veth.|br.|docker.|virbr|lo'}[30m])8
irate(node_network_transmit_bytes_total{instance=~'$node',device!~'tap.|veth.|br.|docker.|virbr|lo'}[30m])*8
cpu使用率
100 - (avg(irate(node_cpu_seconds_total{instance=~"$node",mode="idle"}[1m])) * 100)
(1-((sum(increase(node_cpu_seconds_total{mode="idle"}[1m])) by (instance)) /(sum(increase(node_cpu_seconds_total[1m])) by (instance)))) 100
(1-((sum(increase(node_cpu_seconds_total{mode="idle",job="dev"}[1m])) by (instance)) /(sum(increase(node_cpu_seconds_total[1m])) by (instance)))) 100
内存
((node_memory_MemTotal_bytes{instance=~"$node"} - node_memory_MemFree_bytes{instance=~"$node"} - node_memory_Buffers_bytes{instance=~"$node"} - node_memory_Cached_bytes{instance=~"$node"}) / (node_memory_MemTotal_bytes{instance=~"$node"} )) * 100
八.后续跟进rabbitmq,redis,web,容器和小米数据库代理gaea的监控展示
1.查看主配置文件,节点为服务发现
vi prometheus.yml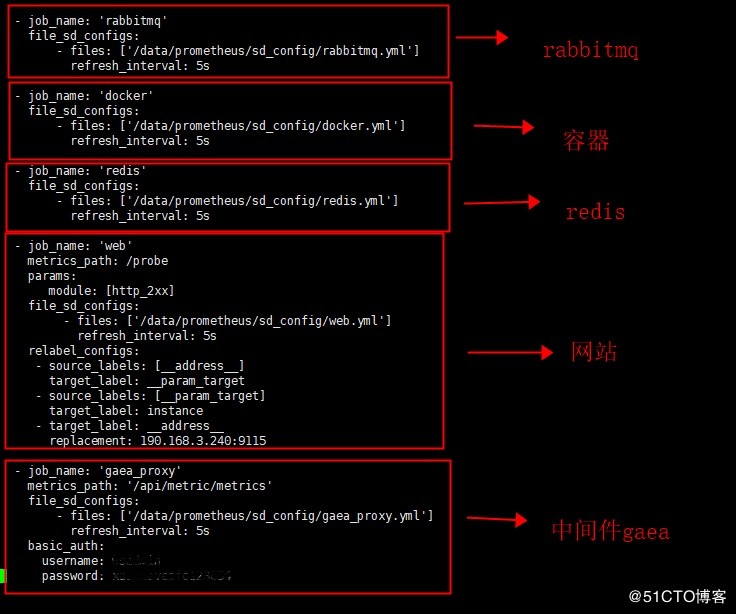
-
job_name: 'rabbitmq'
file_sd_configs:- files: ['/data/prometheus/sd_config/rabbitmq.yml']
refresh_interval: 5s
- files: ['/data/prometheus/sd_config/rabbitmq.yml']
-
job_name: 'docker'
file_sd_configs:- files: ['/data/prometheus/sd_config/docker.yml']
refresh_interval: 5s
- files: ['/data/prometheus/sd_config/docker.yml']
-
job_name: 'redis'
file_sd_configs:- files: ['/data/prometheus/sd_config/redis.yml']
refresh_interval: 5s
- files: ['/data/prometheus/sd_config/redis.yml']
-
job_name: 'web'
metrics_path: /probe
params:
module: [http_2xx]
file_sd_configs:- files: ['/data/prometheus/sd_config/web.yml']
refresh_interval: 5s
relabel_configs:- source_labels: [address]
target_label: __param_target - source_labels: [__param_target]
target_label: instance - target_label: address
replacement: 190.168.3.240:9115
- source_labels: [address]
- files: ['/data/prometheus/sd_config/web.yml']
- job_name: 'gaea_proxy'
metrics_path: '/api/metric/metrics'
file_sd_configs:- files: ['/data/prometheus/sd_config/gaea_proxy.yml']
refresh_interval: 5s
basic_auth:
username: ***
password: **
- files: ['/data/prometheus/sd_config/gaea_proxy.yml']
2.服务发现节点连接配置文件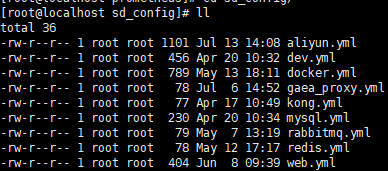
我们看下一下rabbitmq,redis,web,容器和小米数据库代理gaea的节点发现配置
因为线上在用,地址就不方便展示了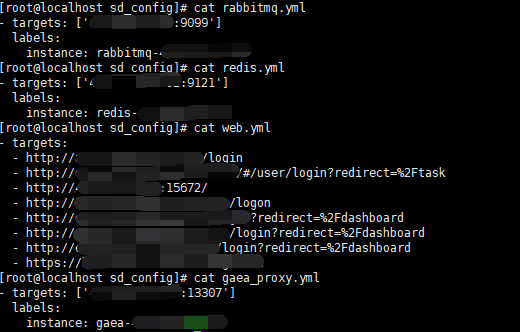
3.rule配置展示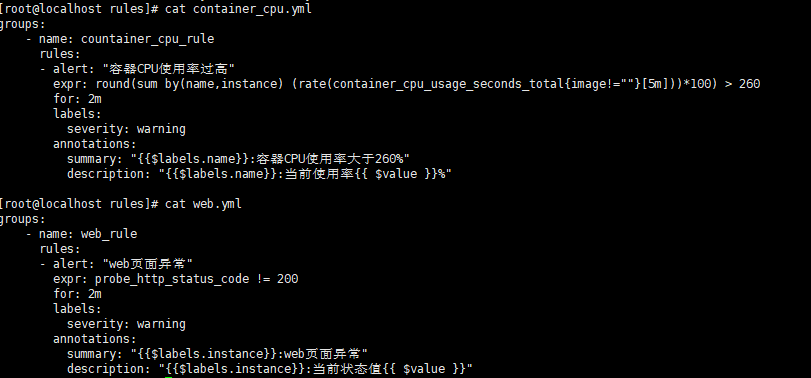
[root@localhost rules]# cat container_cpu.yml
groups:
- name: countainer_cpu_rule
rules:- alert: "容器CPU使用率过高"
expr: round(sum by(name,instance) (rate(container_cpu_usage_seconds_total{image!=""}[5m]))*100) > 260
for: 2m
labels:
severity: warning
annotations:
summary: "{{$labels.name}}:容器CPU使用率大于260%"
description: "{{$labels.name}}:当前使用率{{ $value }}%"
- alert: "容器CPU使用率过高"
[root@localhost rules]# cat web.yml
groups:
- name: web_rule
rules:- alert: "web页面异常"
expr: probe_http_status_code != 200
for: 2m
labels:
severity: warning
annotations:
summary: "{{$labels.instance}}:web页面异常"
description: "{{$labels.instance}}:当前状态值{{ $value }}"
- alert: "web页面异常"
4.节点组件安装
(1)rabbitmq节点需要安装rabbitmq_exporter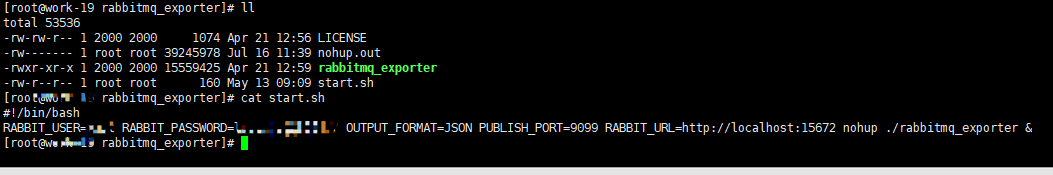
直接启动
RABBIT_USER=* RABBIT_PASSWORD=** OUTPUT_FORMAT=JSON PUBLISH_PORT=9099 RABBIT_URL=http://localhost:15672 nohup ./rabbitmq_exporter &
(2)redis节点需要安装redis_exporter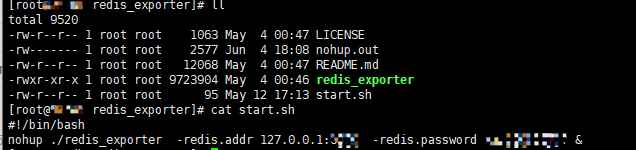
直接启动
nohup ./redis_exporter -redis.addr 127.0.0.1:** -redis.password *** &
(3)web监控需要安装blackbox_exporter
配置文件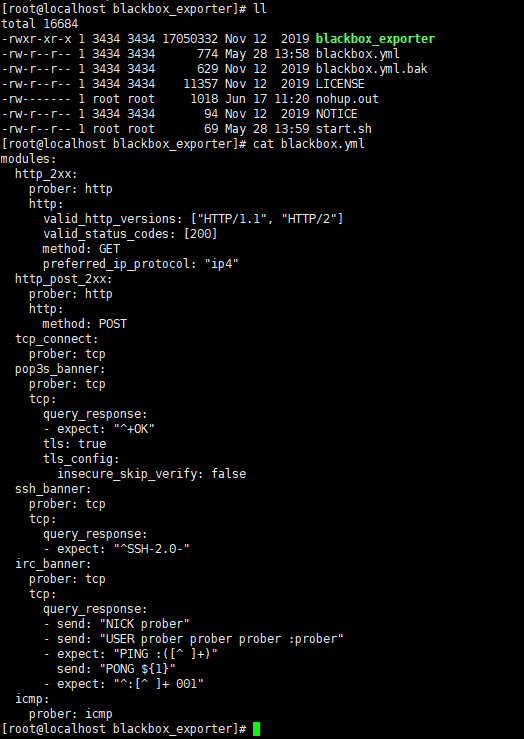
直接启动
nohup ./blackbox_exporter --config.file=./blackbox.yml &
(4)小米数据库代理gaea是go语言写的,原生自带prometheus监控,需要开启
我们只要写好上述的服务发现即可
5.grafana模版展示
模版都进行了修改
(1)rabbitmq 模版id 10982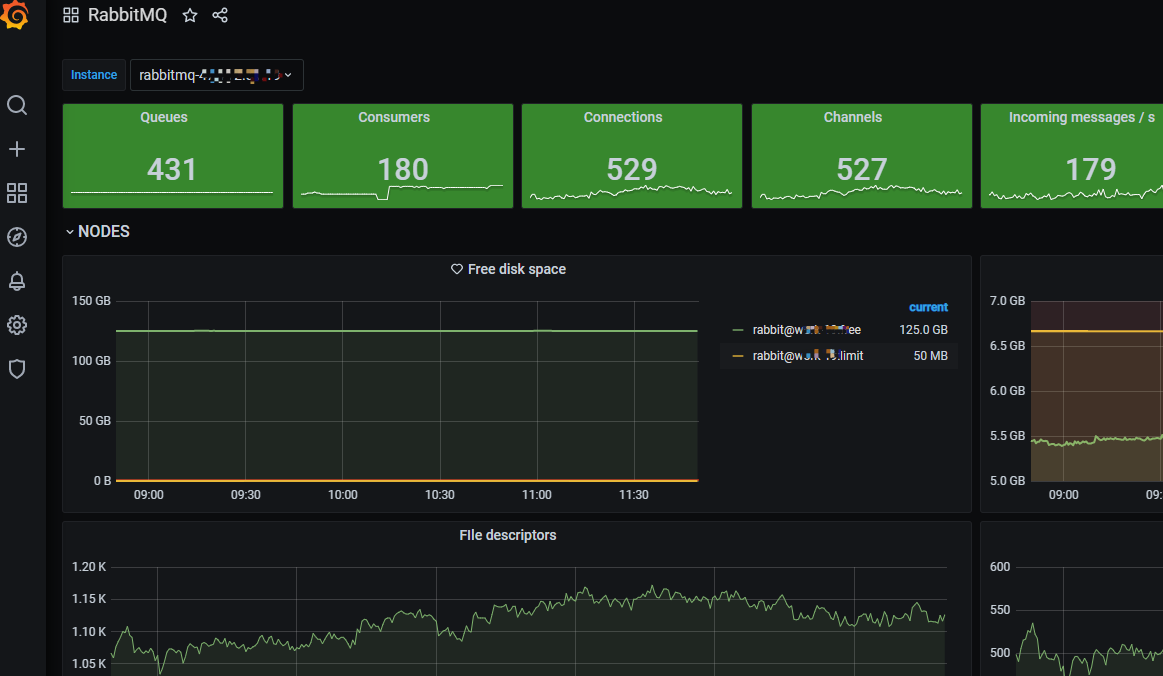
(2)redis 模版id 763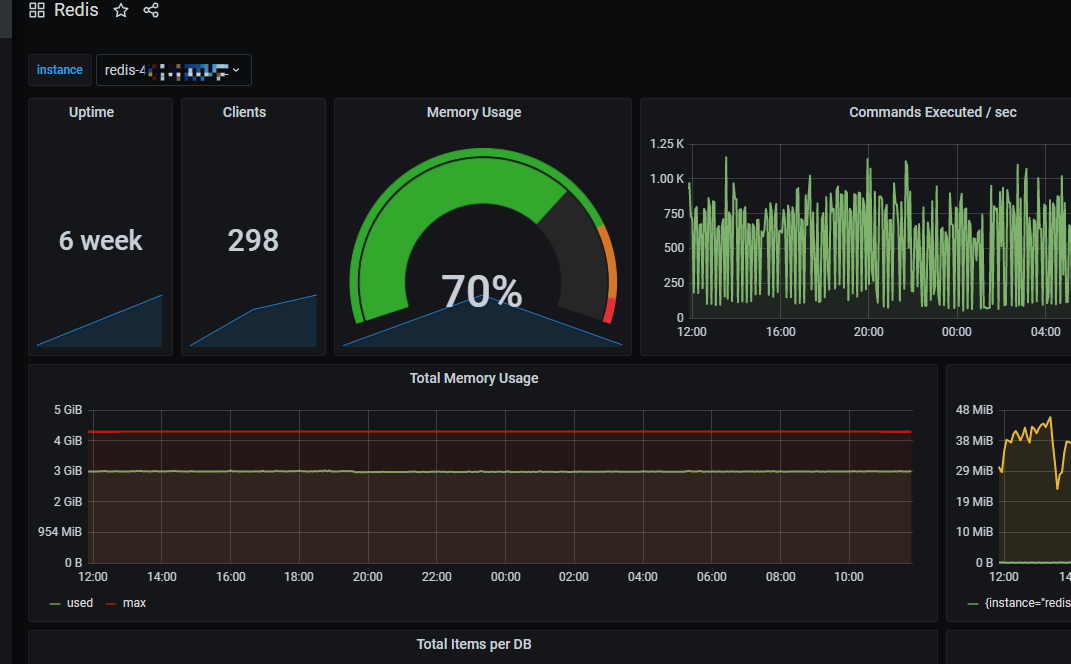
(3)web监控 模版id 9965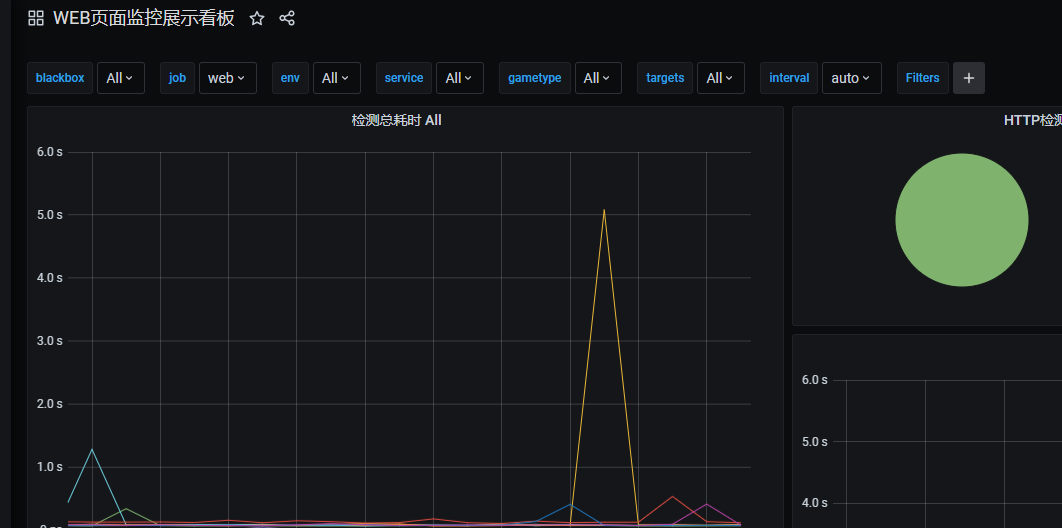
(4)小米数据库代理gaea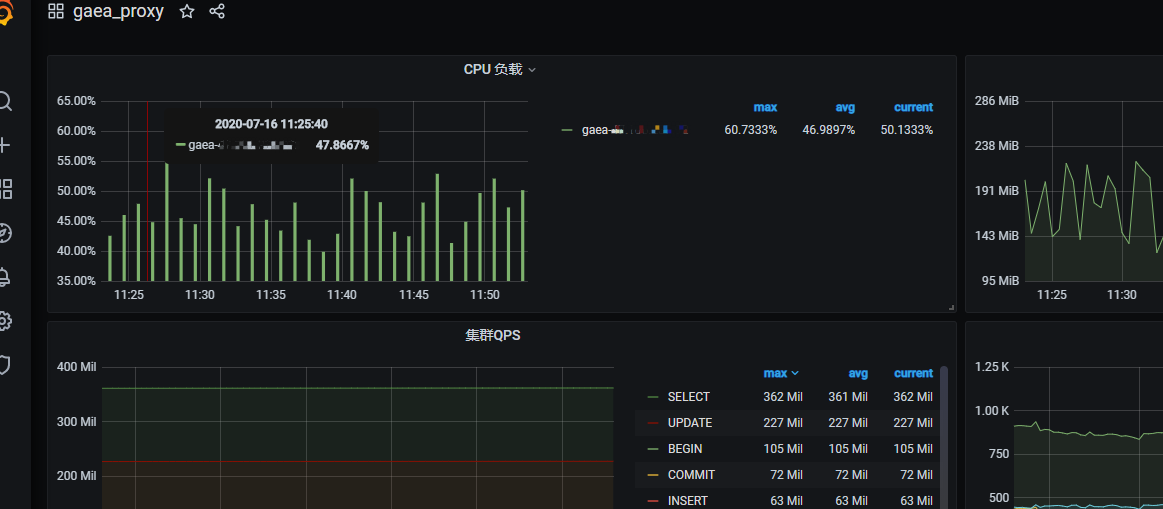

旨在为数千万中国开发者提供一个无缝且高效的云端环境,以支持学习、使用和贡献开源项目。
更多推荐

 3
3 0
0- 0


 已为社区贡献2条内容

所有评论(0)