

While using Excel/Google Sheet for solving an actual problem with machine learning algorithms can be a bad idea, implementing the algorithm from scratch with simple formulas and a simple dataset is very helpful to understand how the algorithm works.
虽然使用Excel / Google Sheet解决机器学习算法的实际问题可能是一个坏主意,但从头开始使用简单的公式和简单的数据集来实现算法对于了解算法的工作原理非常有帮助。
In a series of articles, I will present how to implement different algorithms from scratch in Excel.
在一系列文章中,我将介绍如何从头开始在Excel中实现不同的算法。
- Neural Network With Back Propagation in Excel在Excel中具有反向传播的神经网络
In this article, I will share how I implemented a simple Logistic Regression with Gradient Descent.
在本文中,我将分享如何使用Gradient Descent实现简单的Logistic回归。
You can use this link: Simple logistic regression with gradient descent, to get the Excel/Google Sheet file.
您可以使用此链接:具有梯度下降的简单逻辑回归,以获取Excel / Google表格文件。
Now let’s get our hands dirty!
现在让我们弄脏双手!
使用简单的数据集 (Using a simple dataset)
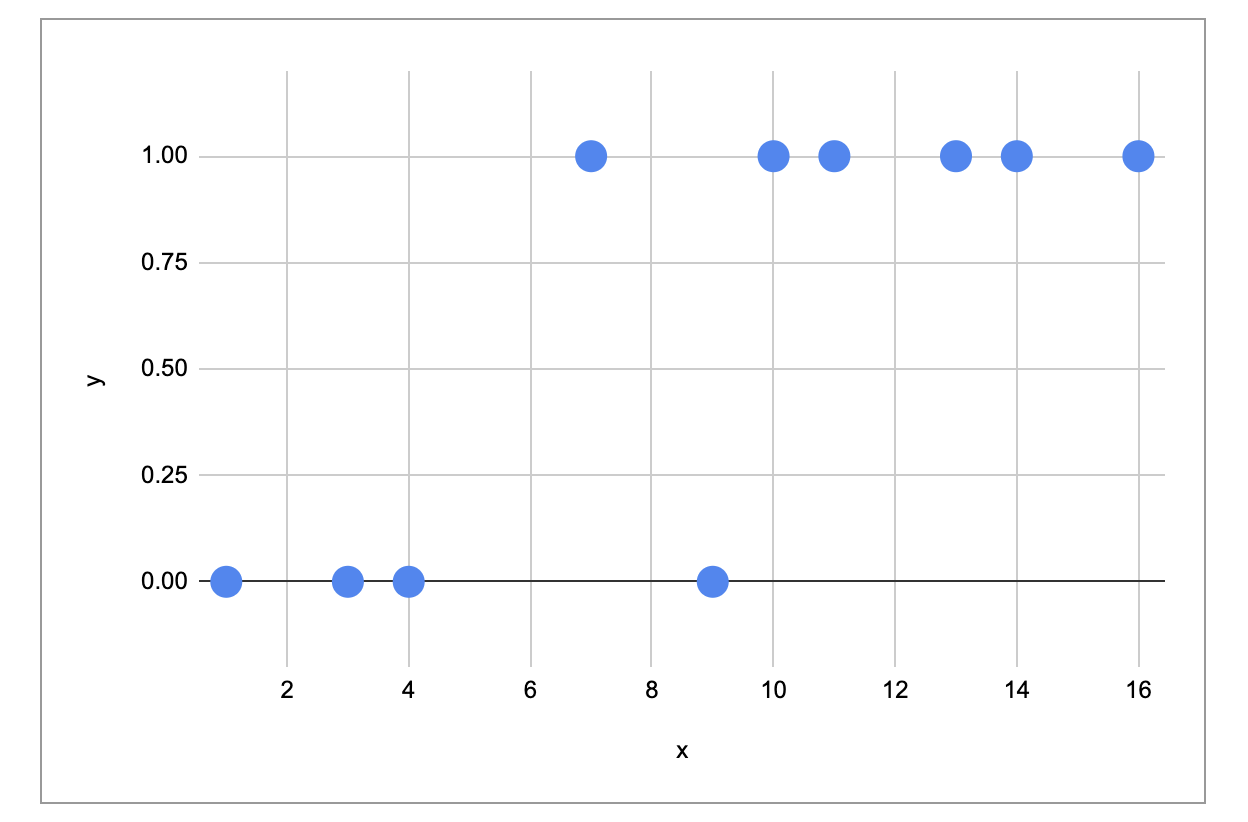
First I use a very simple dataset with one feature, you can see the graph below showing the target variable y and the feature variable x.
首先,我使用一个具有一个特征的非常简单的数据集,您可以看到下面的图形,其中显示了目标变量y和特征变量x。
建立模型 (Creating the model)
The Logistic Regression uses the following model:
Logistic回归使用以下模型:

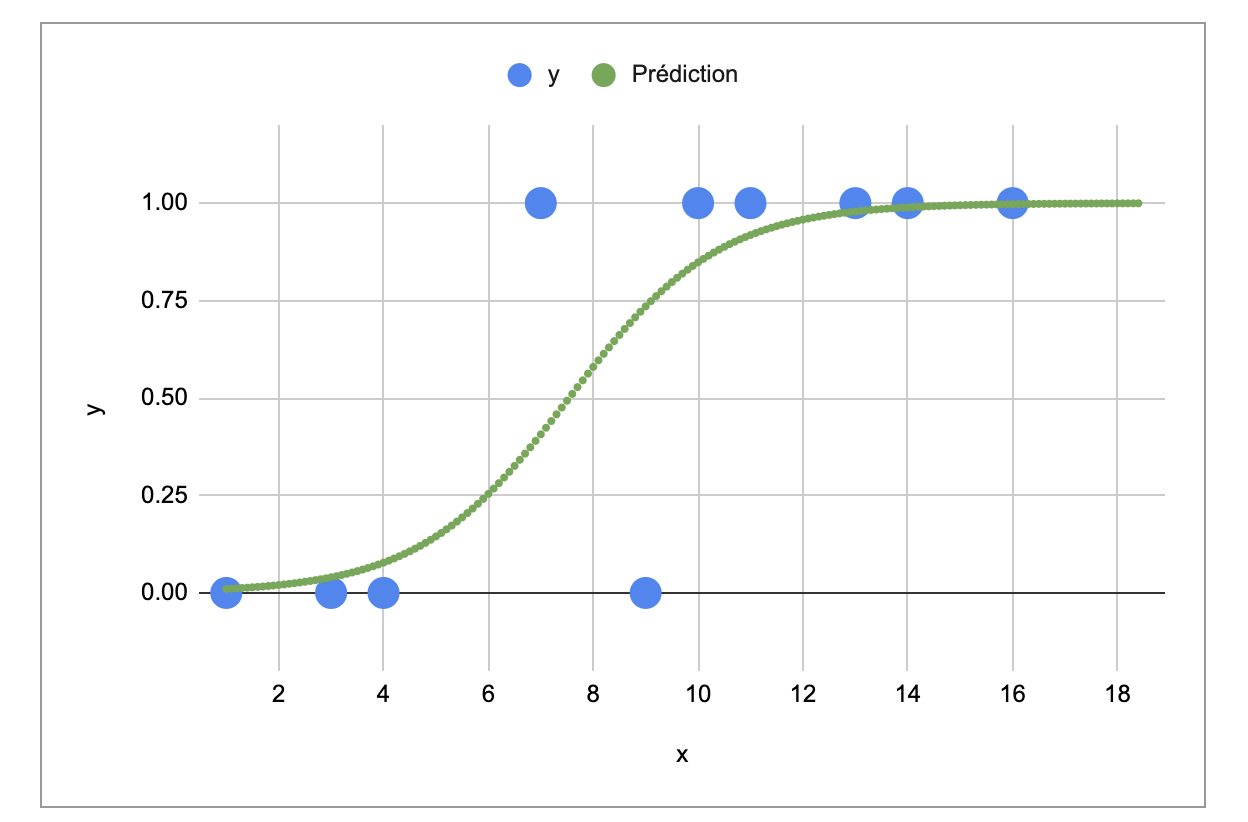
We can see the final model in the “res” sheet in the Excel file, with a and b.
我们可以在Excel文件的“ res”表中看到带有a和b的最终模型。
Now, how a and b were determined? Let see in the next sheet “mlh” for maximum likelihood.
现在,如何确定a和b? 让我们在下一张“ mlh”中查看最大可能性。
模型的成本函数 (The cost function of the model)
First we can consider the likelihood of the model, and we have to maximize:
首先,我们可以考虑模型的可能性,我们必须最大化:

Then we take the log of the likelihood. To have the loss function, we have to take the opposite of the log likelihood.
然后我们取可能性的对数。 为了具有损失函数,我们必须采取与对数似然相反的方法。
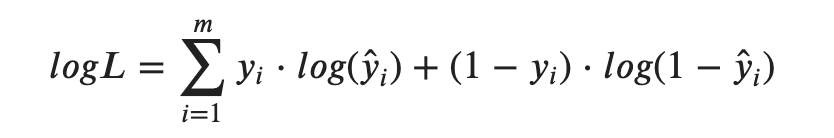
We also name this loss function logistic loss, cross-entropy or log-loss.
我们也称这种损失函数为逻辑损失,交叉熵或对数损失。
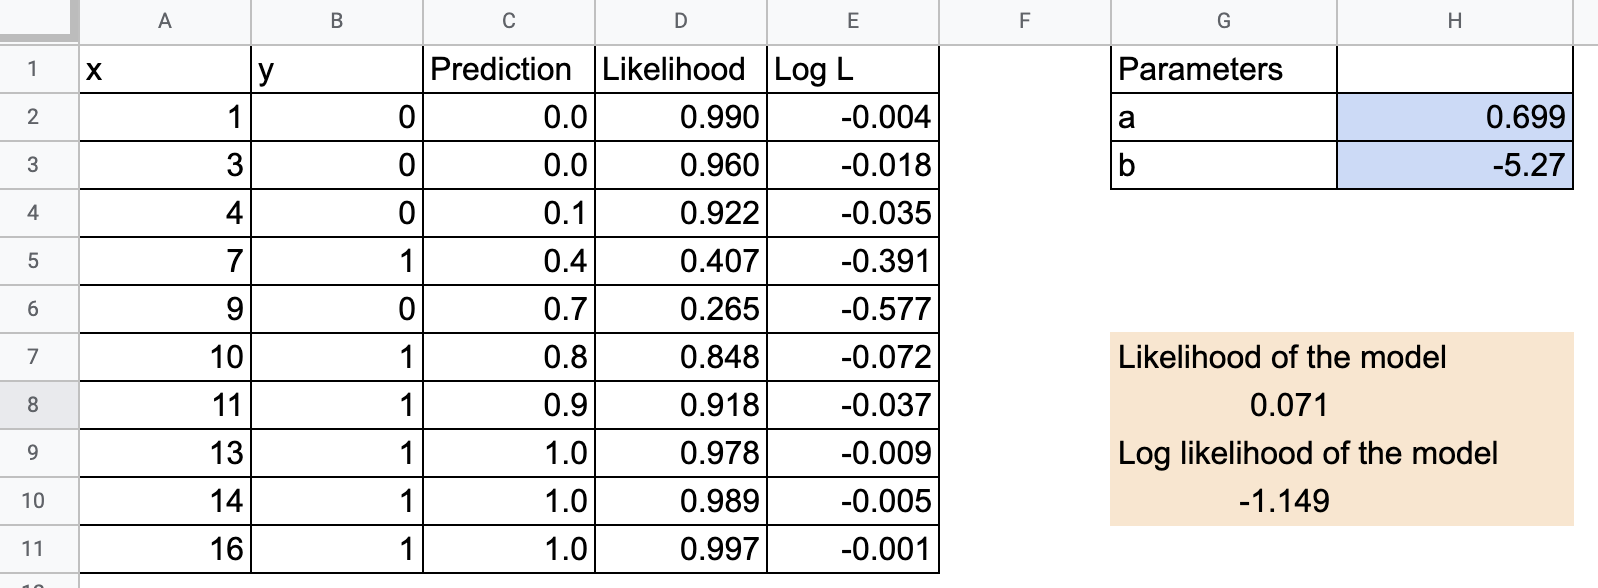
You can modify the parameters a and b to see that the likelihood of the model will vary.
您可以修改参数a和b来查看模型的可能性会变化。
梯度下降 (Gradient descent)
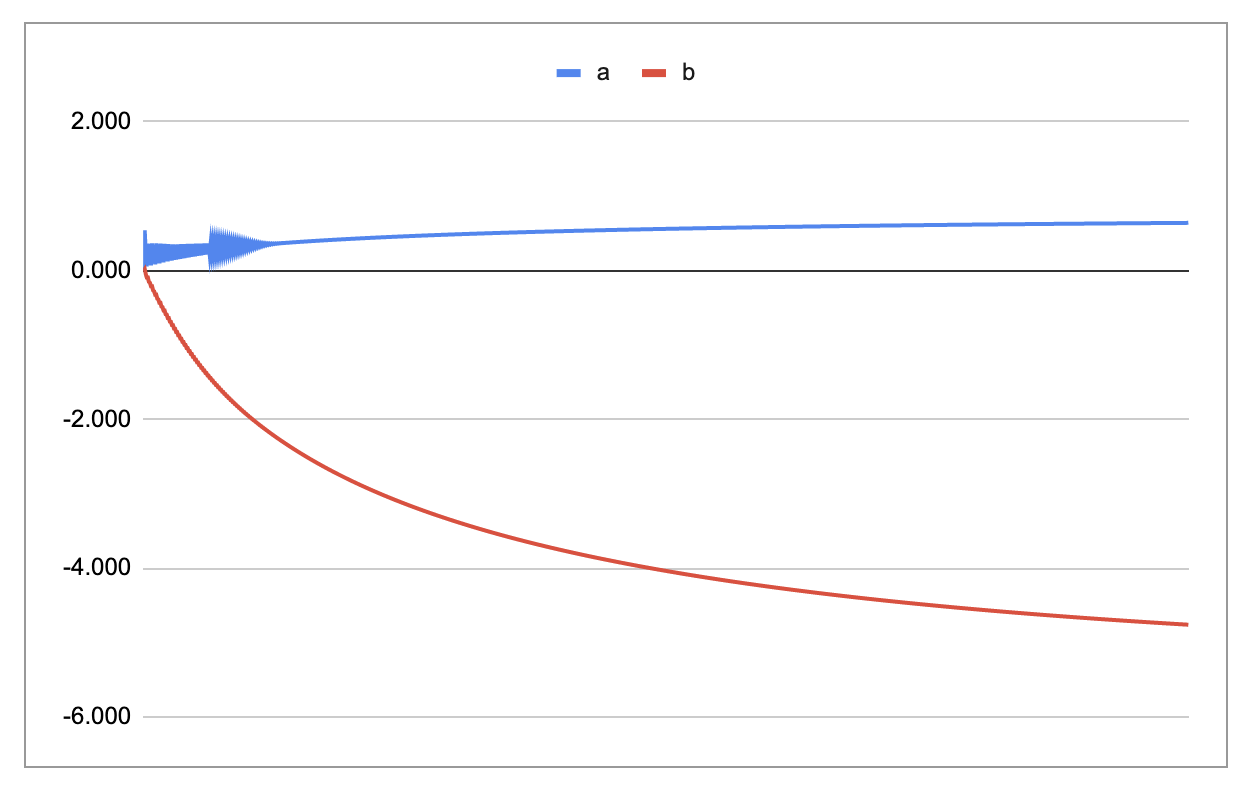
Now let’s find the optimal parameters a and b.
现在让我们找到最佳参数a和b。
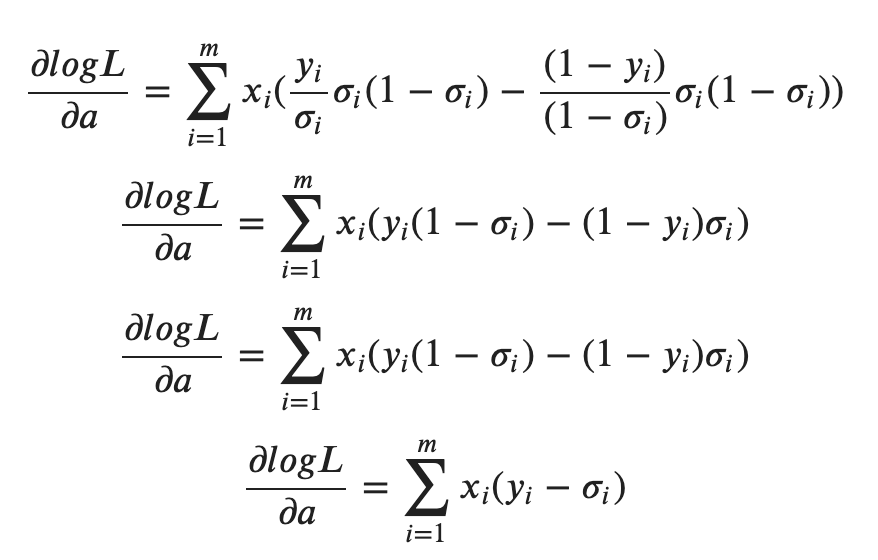
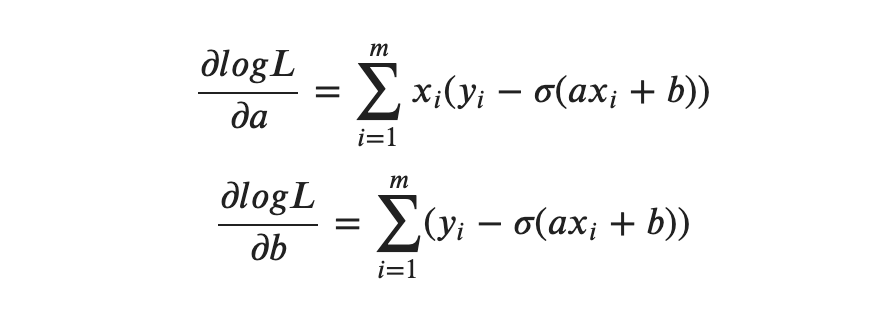
For this, we have to find the derivatives of the loss function with respect to a and b.
为此,我们必须找到关于a和b的损失函数的导数。
In the sheet “graddesc”, you will find all the Excel formulas to implement the gradient descent. Enjoy!
在“ graddesc”工作表中,您将找到实现梯度下降的所有Excel公式。 请享用!
People in all kinds of companies work with Excel. While it will not be used to do machine learning, it is an excellent tool to understand the principles, because you can see how all the calculations are done, and visualize all the figures of intermediary steps. This approach is also very helpful for people who want to understand how machine learning algorithms work and who are not yet at ease with coding.
各种公司的人都使用Excel。 尽管它不会被用来进行机器学习,但它是理解原理的绝佳工具,因为您可以看到所有计算是如何完成的,并将所有中间步骤的图表可视化。 对于想了解机器学习算法如何工作并且尚不熟悉编码的人们来说,这种方法也非常有用。
Now if you are able to understand and implement a Logistic Regression in Excel, you can also do it for a simple Neural Network, you can read this article to have all the formulas. Challenged accepted?
现在,如果您能够在Excel中理解和实现Logistic回归,则还可以通过简单的神经网络来实现,您可以阅读本文以获取所有公式。 接受挑战?
翻译自: https://towardsdatascience.com/logistic-regression-with-gradient-descent-in-excel-52a46c46f704


 已为社区贡献1条内容

所有评论(0)