scikit-learn - 具有置信区间的 ROC 曲线
问题:scikit-learn - 具有置信区间的 ROC 曲线
我可以使用scikit-learn和fpr、tpr、thresholds = metrics.roc_curve(y_true,y_pred, pos_label=1)获得 ROC 曲线,其中y_true是基于我的黄金标准的值列表(即,0表示负例,1表示正例),y_pred是相应的分数列表(例如,0.053497243、0.008521122、0.022781548、0.101885263、0.012913795、0.0、0.042881547[...])
我试图弄清楚如何向该曲线添加置信区间,但没有找到任何简单的方法来使用 sklearn 做到这一点。
解答
您可以引导 ROC 计算(从原始y_true/y_pred中替换新版本的y_true/y_pred的样本,并每次重新计算roc_curve的新值)并以这种方式估计置信区间。
考虑到train test split引起的可变性,你也可以多次使用ShuffleSplitCV迭代器,在train split上拟合一个模型,为每个模型生成y_pred,从而收集roc_curves的经验分布最后计算这些的置信区间。
编辑:python中的引导
这是从单个模型的预测中引导 ROC AUC 分数的示例。我选择引导 ROC AUC 以使其更容易作为 Stack Overflow 的答案,但它可以适应引导整个曲线:
import numpy as np
from scipy.stats import sem
from sklearn.metrics import roc_auc_score

y_pred = np.array([0.21, 0.32, 0.63, 0.35, 0.92, 0.79, 0.82, 0.99, 0.04])
y_true = np.array([0,    1,    0,    0,    1,    1,    0,    1,    0   ])

print("Original ROC area: {:0.3f}".format(roc_auc_score(y_true, y_pred)))

n_bootstraps = 1000
rng_seed = 42  # control reproducibility
bootstrapped_scores = []

rng = np.random.RandomState(rng_seed)
for i in range(n_bootstraps):
    # bootstrap by sampling with replacement on the prediction indices
    indices = rng.randint(0, len(y_pred), len(y_pred))
    if len(np.unique(y_true[indices])) < 2:
        # We need at least one positive and one negative sample for ROC AUC
        # to be defined: reject the sample
        continue

    score = roc_auc_score(y_true[indices], y_pred[indices])
    bootstrapped_scores.append(score)
    print("Bootstrap #{} ROC area: {:0.3f}".format(i + 1, score))
你可以看到我们需要拒绝一些无效的重采样。然而,在具有许多预测的真实数据上,这是一个非常罕见的事件,不应显着影响置信区间(您可以尝试改变rng_seed进行检查)。
这是直方图:
import matplotlib.pyplot as plt
plt.hist(bootstrapped_scores, bins=50)
plt.title('Histogram of the bootstrapped ROC AUC scores')
plt.show()
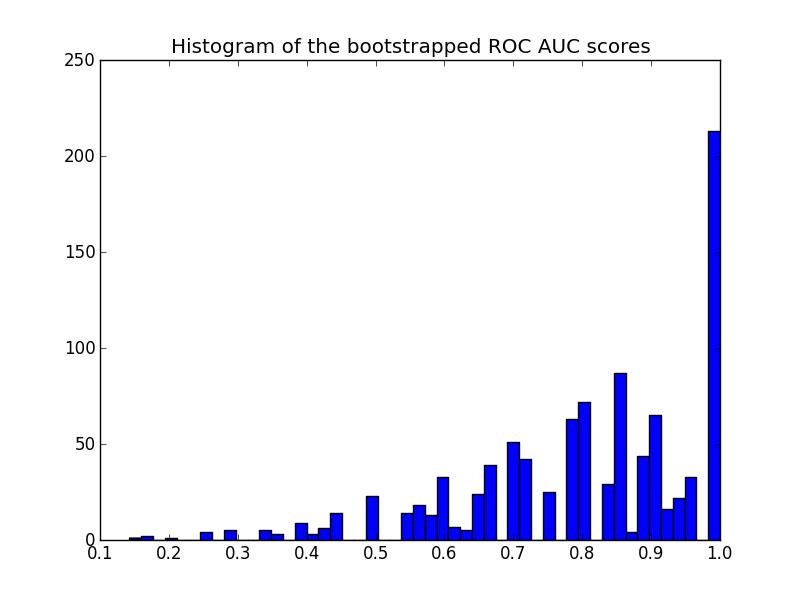
请注意,重新采样的分数在 [0 - 1] 范围内被审查,导致最后一个 bin 中的分数很高。
要获得置信区间,可以对样本进行排序:
sorted_scores = np.array(bootstrapped_scores)
sorted_scores.sort()

# Computing the lower and upper bound of the 90% confidence interval
# You can change the bounds percentiles to 0.025 and 0.975 to get
# a 95% confidence interval instead.
confidence_lower = sorted_scores[int(0.05 * len(sorted_scores))]
confidence_upper = sorted_scores[int(0.95 * len(sorted_scores))]
print("Confidence interval for the score: [{:0.3f} - {:0.3}]".format(
    confidence_lower, confidence_upper))
这使:
Confidence interval for the score: [0.444 - 1.0]
置信区间非常宽,但这可能是我选择预测的结果(9 个预测中有 3 个错误)并且预测的总数非常少。
该图的另一条评论:分数被量化(许多空的直方图箱)。这是少数预测的结果。可以在分数(或y_pred值)上引入一点高斯噪声,以平滑分布并使直方图看起来更好。但是,平滑带宽的选择很棘手。
最后,如前所述,此置信区间特定于您的训练集。为了更好地估计由模型类和参数引起的 ROC 的可变性,您应该改为进行迭代交叉验证。然而,这通常成本更高,因为您需要为每个随机训练/测试拆分训练一个新模型。
编辑:自从我第一次写这个回复以来,scipy 中直接有一个引导实现:
https://docs.scipy.org/doc/scipy/reference/generated/scipy.stats.bootstrap.html

Python社区为您提供最前沿的新闻资讯和知识内容
更多推荐

 0
0 0
0- 0


 已为社区贡献126440条内容

所有评论(0)