如何在python中使用networkx绘制有向图?
·
回答问题
我有一些来自我想映射到图表的脚本的节点。在下面,我想使用箭头从 A 到 D,并且可能将边缘也涂上颜色(红色或其他东西)。
这基本上就像在所有其他节点都存在时从 A 到 D 的路径。您可以将每个节点想象成城市,从 A 到 D 的旅行需要方向(带有箭头)。
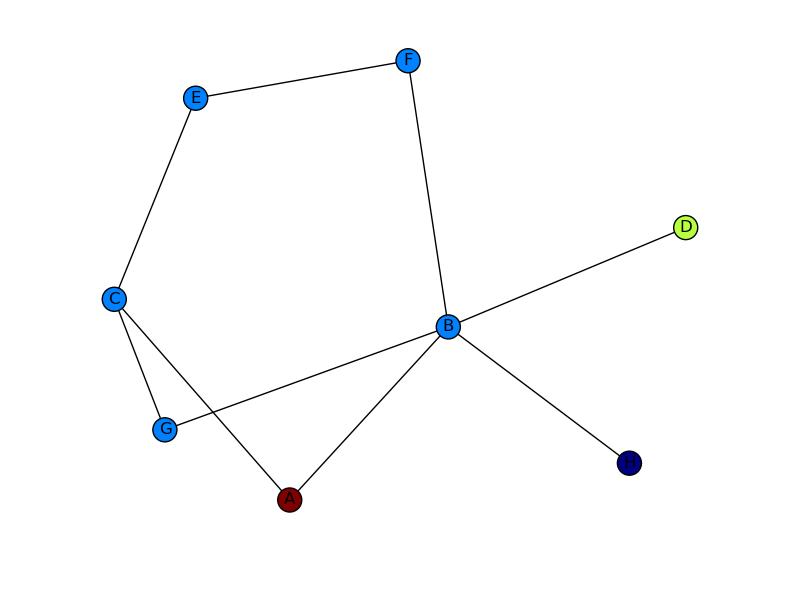
下面的代码构建了图表
import networkx as nx
import numpy as np
import matplotlib.pyplot as plt

G = nx.Graph()
G.add_edges_from(
    [('A', 'B'), ('A', 'C'), ('D', 'B'), ('E', 'C'), ('E', 'F'),
     ('B', 'H'), ('B', 'G'), ('B', 'F'), ('C', 'G')])

val_map = {'A': 1.0,
           'D': 0.5714285714285714,
           'H': 0.0}

values = [val_map.get(node, 0.25) for node in G.nodes()]

nx.draw(G, cmap = plt.get_cmap('jet'), node_color = values)
plt.show()
但我想要如图所示的东西。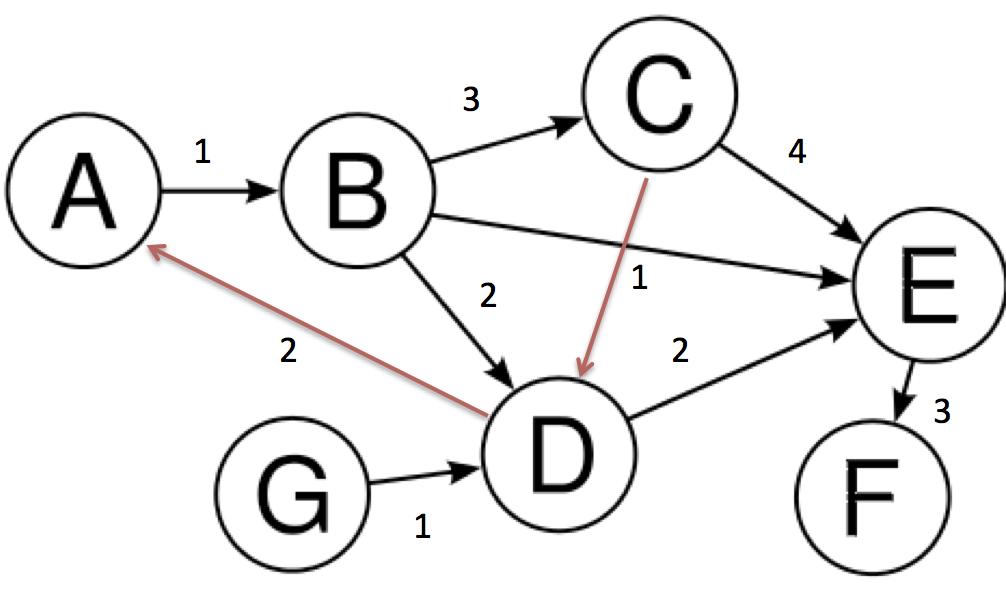
第一个图像的箭头和第二个图像上的红色边缘。
Answers
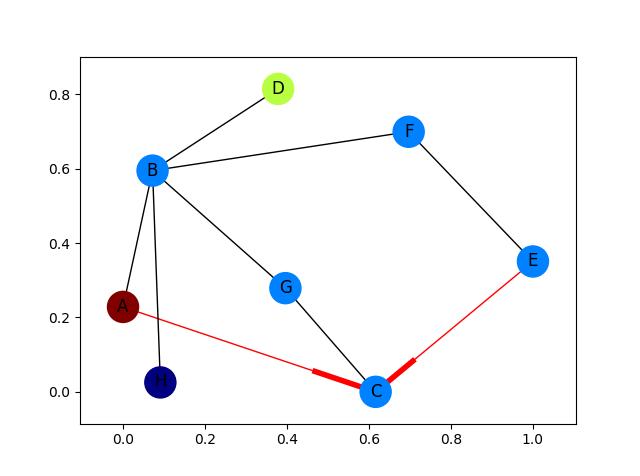
仅红色边缘的箭头完全充实示例:
import networkx as nx
import matplotlib.pyplot as plt

G = nx.DiGraph()
G.add_edges_from(
    [('A', 'B'), ('A', 'C'), ('D', 'B'), ('E', 'C'), ('E', 'F'),
     ('B', 'H'), ('B', 'G'), ('B', 'F'), ('C', 'G')])

val_map = {'A': 1.0,
           'D': 0.5714285714285714,
           'H': 0.0}

values = [val_map.get(node, 0.25) for node in G.nodes()]

# Specify the edges you want here
red_edges = [('A', 'C'), ('E', 'C')]
edge_colours = ['black' if not edge in red_edges else 'red'
                for edge in G.edges()]
black_edges = [edge for edge in G.edges() if edge not in red_edges]

# Need to create a layout when doing
# separate calls to draw nodes and edges
pos = nx.spring_layout(G)
nx.draw_networkx_nodes(G, pos, cmap=plt.get_cmap('jet'),
                       node_color = values, node_size = 500)
nx.draw_networkx_labels(G, pos)
nx.draw_networkx_edges(G, pos, edgelist=red_edges, edge_color='r', arrows=True)
nx.draw_networkx_edges(G, pos, edgelist=black_edges, arrows=False)
plt.show()

Python社区为您提供最前沿的新闻资讯和知识内容
更多推荐

 0
0 0
0- 0


 已为社区贡献126442条内容

所有评论(0)