I have a python script I'm trying to debug and I'm using Pycharm Community Edition version 2016.3.2.
What I'd like to do is make some plots in the debug console (which I activate by setting a breakpoint and starting the debugger), but the problem is that the plot simply doesn't show up.
Some code to get a reproducible example of my problem is provided on the official matplotlib documentation here, in particular this bit of code:
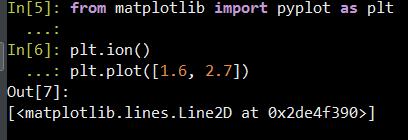
import matplotlib.pyplot as plt
plt.ion()
plt.plot([1.6, 2.7])
What I find strange is that if I open a new python console from inside pycharm, when executing this code pycharm pops up a new window showing the plot, but this doesn't happen if I paste the same code in the "debug" console.
In both cases, I get the following output in the console
I found a potentially related post here, but frankly I can't tell if the two problems reduce to the same issue.
- Tested in
python 3.8.12, matplotlib 3.4.3, PyCharm 2021.2.3 (Professional Edition)
- In PyCharm Create a Pure Python Project
- File New Project... Pure Python
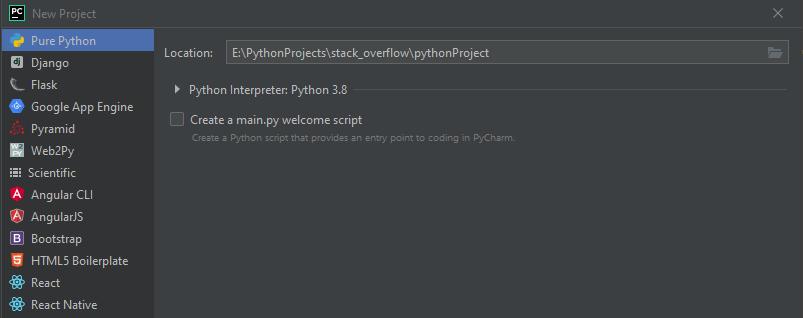
- Finish the project setup
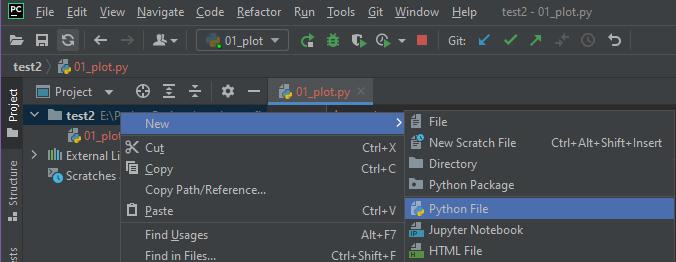
- Create a new python file:
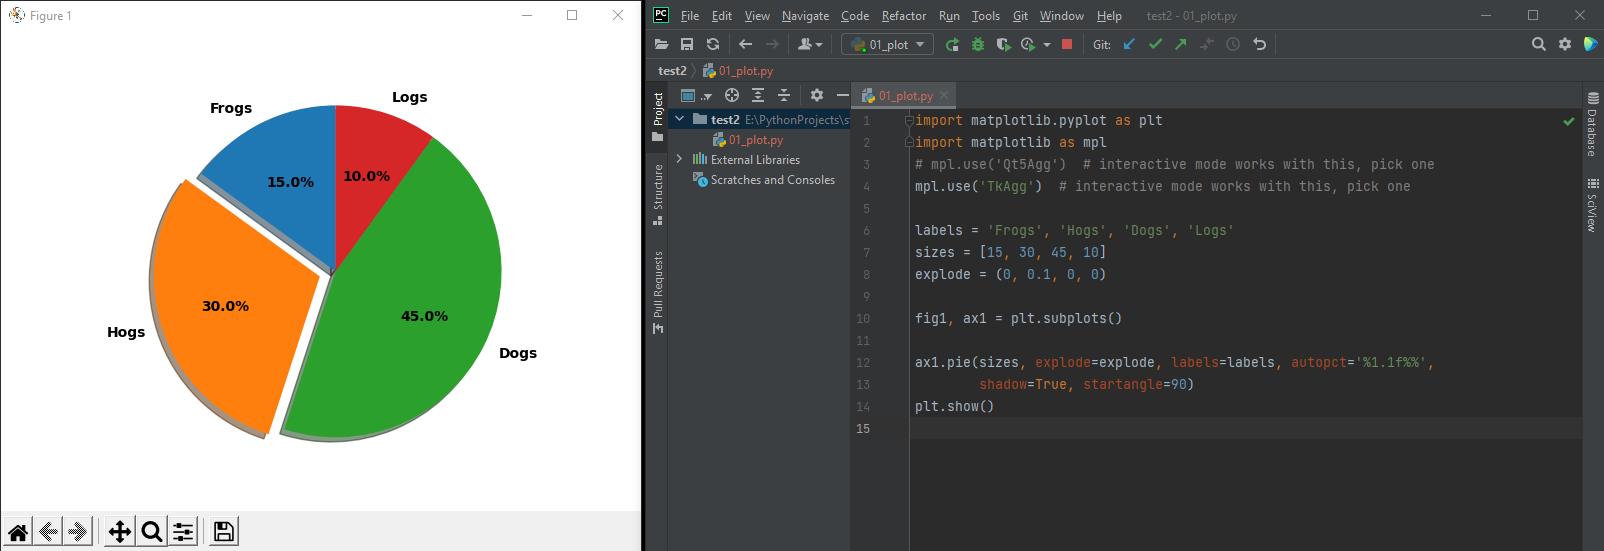
- After the package imports, specify an interactive backend
mpl.use('Qt5Agg')mpl.use('TkAgg')
import matplotlib.pyplot as plt
import matplotlib as mpl
# mpl.use('Qt5Agg')  # interactive mode works with this, pick one
mpl.use('TkAgg')  # interactive mode works with this, pick one

# Pie chart, where the slices will be ordered and plotted counter-clockwise:
labels = 'Frogs', 'Hogs', 'Dogs', 'Logs'
sizes = [15, 30, 45, 10]
explode = (0, 0.1, 0, 0)

fig1, ax1 = plt.subplots()

ax1.pie(sizes, explode=explode, labels=labels, autopct='%1.1f%%', shadow=True, startangle=90)
ax1.axis('equal')

plt.show()
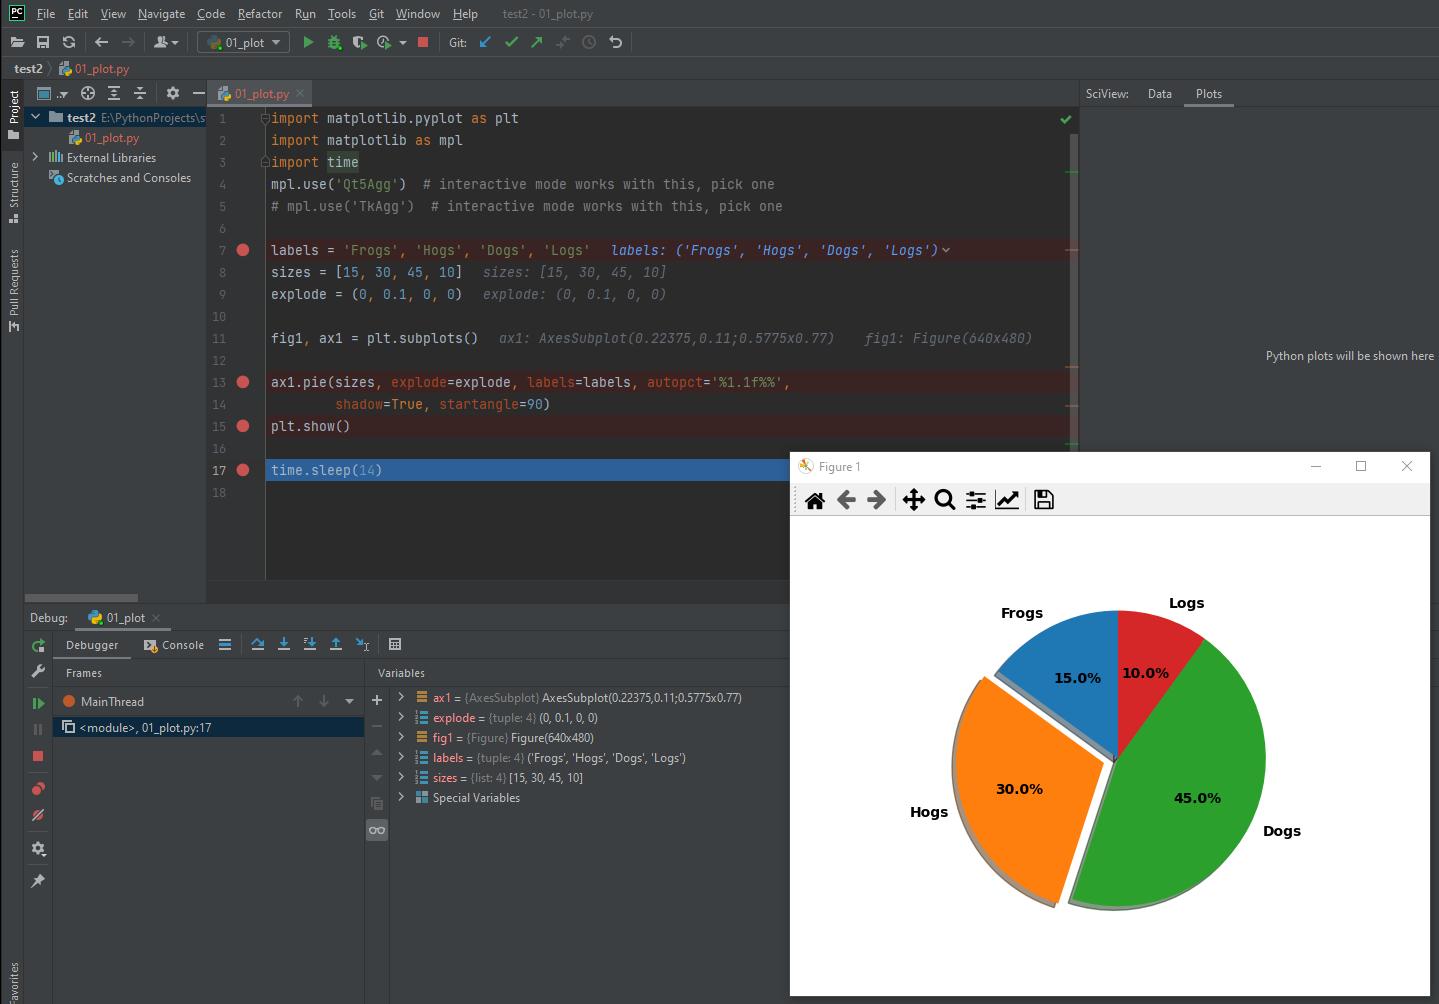
Debug Console
- The script also works with debug, but the plot shows and then goes away as the debugger closes, so an extra line is included to prevent the debugger from closing the plot window.


 已为社区贡献126440条内容

所有评论(0)