How to set the size of the figure ploted by ScikitLearn's Confusion Matrix?
import numpy as np
from sklearn.metrics import ConfusionMatrixDisplay, confusion_matrix
cm = confusion_matrix(np.arange(25), np.arange(25))
cmp = ConfusionMatrixDisplay(cm, display_labels=np.arange(25))
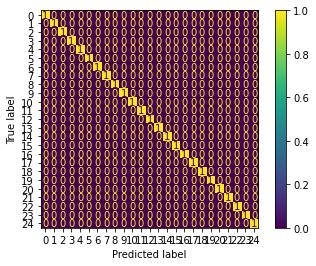
cmp.plot()
The code above shows this figure, which is too tight:
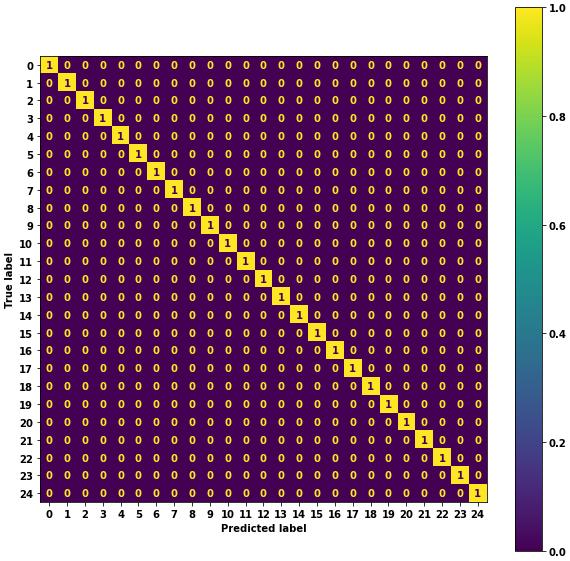
You can send a matplotlib.axes object to the .plot method of sklearn.metrics.ConfusionMatrixDisplay. Set the size of the figure in matplotlib.pyplot.subplots first.
import numpy as np
from sklearn.metrics import ConfusionMatrixDisplay, confusion_matrix
import matplotlib.pyplot as plt

cm = confusion_matrix(np.arange(25), np.arange(25))
cmp = ConfusionMatrixDisplay(cm, display_labels=np.arange(25))
fig, ax = plt.subplots(figsize=(10,10))
cmp.plot(ax=ax)


 已为社区贡献126445条内容

所有评论(0)