

1. Draw dynamic line chart
. 1.1 draw a dynamic broken line diagram that does not start when the , x-axis coordinate is 0 ,
import os
import numpy as np
import matplotlib.pyplot as plt
import imageio
# The number of generated values is between 40 and 50
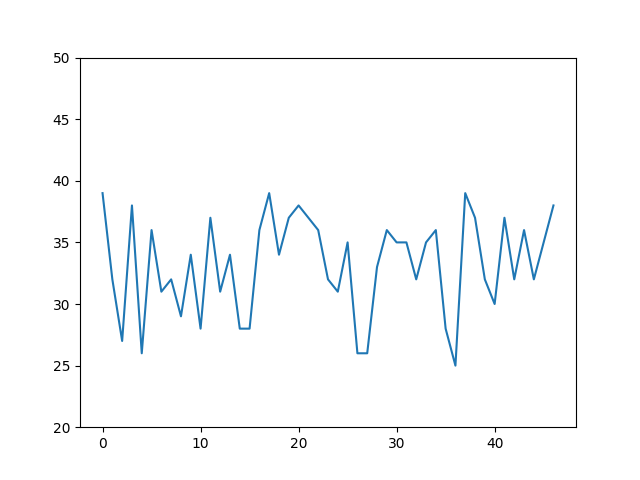
y = np.random.randint(25,40,size = 50)
# Draw polylines
plt.plot(y)
# Sets the minimum and maximum values of the y-axis
plt.ylim(20,50)
plt.show()
# Slice the integer list to generate charts at different stages
# Figure 1
plt.plot(y[:-3])
plt.ylim(20,50)
plt.savefig('1.png')
plt.show()
# Sheet 2
plt.plot(y[:-2])
plt.ylim(20,50)
plt.savefig('2.png')
plt.show()
# Figure 3
plt.plot(y[:-1])
plt.ylim(20,50)
plt.savefig('3.png')
plt.show()
# Figure 4
plt.plot(y)
plt.ylim(20,50)
plt.savefig('4.png')
plt.show()
# With these four images, we can use Imageio to generate GIF
with imageio.get_writer('mygif.gif',mode='I') as writer:
for filename in ['1.png','2.png','3.png','4.png']:
image = imageio.imread(filename)
writer.append_data(image)
 It is not a dynamic line chart starting from the time when the coordinate of # x axis is 0 #
1.2 draw the dynamic broken line diagram of # from the time when the # x-axis coordinate is 0 #
# Generate 40 numbers with values between 40-50
y = np.random.randint(25,40,size = 50)
filenames = []
num = 0
for i in y:
    num += 1
    # Draw 40 line charts
    plt.plot(y[:num])
    plt.ylim(20,50)

    # Save picture file
    filename = f'{num}.png'
    filenames.append(filename)
    plt.savefig(filename)
    plt.close()

# Generate gif
with imageio.get_writer('mygif2.gif',mode='I') as writer:
    for filename in filenames:
        image = imageio.imread(filename)
        writer.append_data(image)
# Delete 40 line charts
for filename in set(filenames):
    os.remove(filename)
 Dynamic line graph of , starting when the , x-axis coordinate is 0 ,
2. Bar chart
The above line chart only has one y value at a time, while the bar chart needs all y values so that all bars can move at the same time.
Create fixed values for the X axis, create lists for the Y axis, and use the bar graph function of Matplotlib
# Generate 40 numbers with values between 40-50
y = np.random.randint(25,40,size = 50)
x = [1,2,3,4,5]
coordinates_lists = [[0, 0, 0, 0, 0],
                     [10, 30, 60, 30, 10],
                     [70, 40, 20, 40, 70],
                     [10, 20, 30, 40, 50],
                     [50, 40, 30, 20, 10],
                     [75, 0, 75, 0, 75],
                     [0, 0, 0, 0, 0]]
filenames = []
for index,y in enumerate(coordinates_lists):
    # Bar chart
    plt.bar(x, y)
    plt.ylim(0, 80)

    # Save picture file
    filename = f'{index}.png'
    filenames.append(filename)

    # Repeat the last picture for 15 frames (all values are 0) and 15 pictures
    if (index == len(coordinates_lists) - 1):
        for i in range(15):
            filenames.append(filename)

    # preservation
    plt.savefig(filename)
    plt.close()

# Generate gif
with imageio.get_writer('mygif3.gif', mode='I') as writer:
    for filename in filenames:
        image = imageio.imread(filename)
        writer.append_data(image)

# Delete 20 bar charts
for filename in set(filenames):
    os.remove(filename)

There are 5 bar graph pictures with values and 2 + 15 = 17 pictures without values.
GIF end segment, added 15 frames of blank pictures. So at the end, a blank period of time will be displayed.
You can set the speed from the current position of the bar graph to the next position to make the transition smooth.
Divides the distance between the current position and the next position by the number of transition frames.
n_frames = 10
x = [1, 2, 3, 4, 5]
coordinates_lists = [[0, 0, 0, 0, 0],
                     [10, 30, 60, 30, 10],
                     [70, 40, 20, 40, 70],
                     [10, 20, 30, 40, 50],
                     [50, 40, 30, 20, 10],
                     [75, 0, 75, 0, 75],
                     [0, 0, 0, 0, 0]]
print('Generate chart\n')
filenames = []
for index in np.arange(0, len(coordinates_lists) - 1):
    # Obtain the y-axis coordinate values of the current image and the next image
    y = coordinates_lists[index]
    y1 = coordinates_lists[index + 1]

    # Calculate the difference between the y-axis coordinates of the current image and the next image
    y_path = np.array(y1) - np.array(y)
    for i in np.arange(0, n_frames + 1):
        # Assign the y-axis movement distance for each frame
        # Increase the coordinate value of the y-axis frame by frame
        y_temp = (y + (y_path / n_frames) * i)
        # Draw bar chart
        plt.bar(x, y_temp)
        plt.ylim(0, 80)
        # Save images for each frame
        filename = f'frame_{index}_{i}.png'
        filenames.append(filename)
        # The last frame repeats and the picture stays for a while
        if (i == n_frames):
            for i in range(5):
                filenames.append(filename)
        # Save picture
        plt.savefig(filename)
        plt.close()
print('Save chart\n')
# Generate GIF
print('generate GIF\n')
with imageio.get_writer('mybars.gif', mode='I') as writer:
    for filename in filenames:
        image = imageio.imread(filename)
        writer.append_data(image)
print('preservation GIF\n')
print('Delete picture\n')
# Delete picture
for filename in set(filenames):
    os.remove(filename)
print('complete')
It looks smoother. OK, next, let's change the configuration parameters related to the chart to make the chart look good.
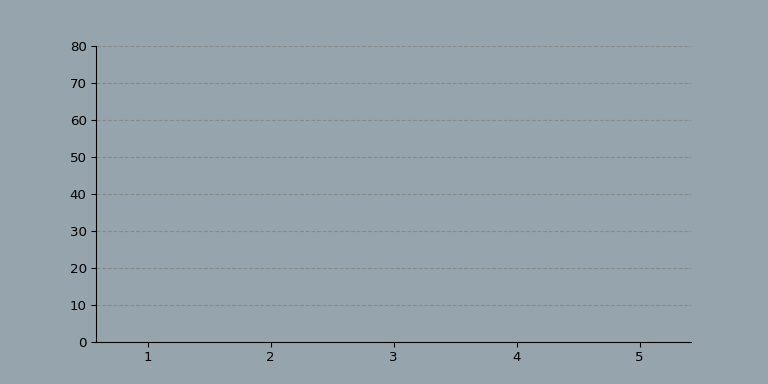
n_frames = 10
bg_color = '#95A4AD'
bar_color = '#283F4E'
gif_name = 'bars'
x = [1, 2, 3, 4, 5]
coordinates_lists = [[0, 0, 0, 0, 0],
                     [10, 30, 60, 30, 10],
                     [70, 40, 20, 40, 70],
                     [10, 20, 30, 40, 50],
                     [50, 40, 30, 20, 10],
                     [75, 0, 75, 0, 75],
                     [0, 0, 0, 0, 0]]
print('Generate chart\n')
filenames = []
for index in np.arange(0, len(coordinates_lists) - 1):
    y = coordinates_lists[index]
    y1 = coordinates_lists[index + 1]
    y_path = np.array(y1) - np.array(y)
    for i in np.arange(0, n_frames + 1):
        y_temp = (y + (y_path / n_frames) * i)
        # Draw bar chart
        fig, ax = plt.subplots(figsize=(8, 4))
        ax.set_facecolor(bg_color)
        plt.bar(x, y_temp, width=0.4, color=bar_color)
        plt.ylim(0, 80)
        # Remove the top and right borders of the chart
        ax.spines['right'].set_visible(False)
        ax.spines['top'].set_visible(False)
        # Set dashed gridlines
        ax.set_axisbelow(True)
        ax.yaxis.grid(color='gray', linestyle='dashed', alpha=0.7)
        # Save images for each frame
        filename = f'images/frame_{index}_{i}.png'
        filenames.append(filename)

        # The last frame repeats and the picture stays for a while
        if (i == n_frames):
            for i in range(5):
                filenames.append(filename)
        # Save picture
        plt.savefig(filename, dpi=96, facecolor=bg_color)
        plt.close()
print('Save chart\n')
# Generate GIF
print('generate GIF\n')
with imageio.get_writer(f'{gif_name}.gif', mode='I') as writer:
    for filename in filenames:
        image = imageio.imread(filename)
        writer.append_data(image)
print('preservation GIF\n')
print('Delete picture\n')
# Delete picture
for filename in set(filenames):
    os.remove(filename)
print('complete')
3. Scatter diagram
To draw a dynamic scatter chart, you need to consider the values of both the x-axis and the y-axis.
Here, it is not necessary to display the same number of points on each frame, so it needs to be corrected for transition.
import os
import numpy as np
import matplotlib.pyplot as plt
import imageio
coordinates_lists = [[[0], [0]],
                     [[100, 200, 300], [100, 200, 300]],
                     [[400, 500, 600], [400, 500, 600]],
                     [[400, 500, 600, 400, 500, 600], [400, 500, 600, 600, 500, 400]],
                     [[500], [500]],
                     [[0], [0]]]
gif_name = 'movie'
n_frames = 10
bg_color = '#95A4AD'
marker_color = '#283F4E'
marker_size = 25
print('Generate chart\n')
filenames = []
for index in np.arange(0, len(coordinates_lists) - 1):
    # Obtain the x and y coordinate values of the current image and the next image
    x = coordinates_lists[index][0]
    y = coordinates_lists[index][1]
    x1 = coordinates_lists[index + 1][0]
    y1 = coordinates_lists[index + 1][1]
    # View the difference between two points
    while len(x) < len(x1):
        diff = len(x1) - len(x)
        x = x + x[:diff]
        y = y + y[:diff]
    while len(x1) < len(x):
        diff = len(x) - len(x1)
        x1 = x1 + x1[:diff]
        y1 = y1 + y1[:diff]
    # Calculation path
    x_path = np.array(x1) - np.array(x)
    y_path = np.array(y1) - np.array(y)
    for i in np.arange(0, n_frames + 1):
        # Calculate current position
        x_temp = (x + (x_path / n_frames) * i)
        y_temp = (y + (y_path / n_frames) * i)
        # Draw a chart
        fig, ax = plt.subplots(figsize=(6, 6), subplot_kw=dict(aspect="equal"))
        ax.set_facecolor(bg_color)

        plt.scatter(x_temp, y_temp, c=marker_color, s=marker_size)
        plt.xlim(0, 1000)
        plt.ylim(0, 1000)
        # Remove border line
        ax.spines['right'].set_visible(False)
        ax.spines['top'].set_visible(False)
        # Grid line
        ax.set_axisbelow(True)
        ax.yaxis.grid(color='gray', linestyle='dashed', alpha=0.7)
        ax.xaxis.grid(color='gray', linestyle='dashed', alpha=0.7)
        # Save picture
        filename = f'frame_{index}_{i}.png'
        filenames.append(filename)
        if (i == n_frames):
            for i in range(5):
                filenames.append(filename)
        # preservation
        plt.savefig(filename, dpi=96, facecolor=bg_color)
        plt.close()
print('Save chart\n')
# Generate GIF
print('generate GIF\n')
with imageio.get_writer(f'{gif_name}.gif', mode='I') as writer:
    for filename in filenames:
        image = imageio.imread(filename)
        writer.append_data(image)
print('preservation GIF\n')
print('Delete picture\n')
# Delete picture
for filename in set(filenames):
    os.remove(filename)
print('complete')
Of course, there are more interesting scatter changes, such as letter changes.
Use OpenCV to create a mask from an image, draw a graph filled with random x/y coordinates, and filter the points in the mask.
Use Matplotlib to draw the scatter diagram, and use ImageIO to generate gif.
import os
import numpy as np
import matplotlib.pyplot as plt
import imageio
import random
import cv2


# According to the shape of the letter, the letter is transformed into multiple random points
def get_masked_data(letter, intensity=2):
    # Fill letters with multiple random points
    random.seed(420)
    x = []
    y = []

    for i in range(intensity):
        x = x + random.sample(range(0, 1000), 500)
        y = y + random.sample(range(0, 1000), 500)

    if letter == ' ':
        return x, y

    # Get the mask of the picture
    mask = cv2.imread(f'images/letters/{letter.upper()}.png', 0)
    mask = cv2.flip(mask, 0)

    # Whether the checkpoint is in the mask
    result_x = []
    result_y = []
    for i in range(len(x)):
        if (mask[y[i]][x[i]]) == 0:
            result_x.append(x[i])
            result_y.append(y[i])

    # Return x,y
    return result_x, result_y


# Cut the text into letters
def text_to_data(txt, repeat=True, intensity=2):
    print('Convert text to data\n')
    letters = []
    for i in txt.upper():
        letters.append(get_masked_data(i, intensity=intensity))
    # If repeat is 1, repeat the first letter
    if repeat:
        letters.append(get_masked_data(txt[0], intensity=intensity))
    return letters


def build_gif(coordinates_lists, gif_name='movie', n_frames=10, bg_color='#95A4AD',
              marker_color='#283F4E', marker_size=25):
    print('Generate chart\n')
    filenames = []
    for index in np.arange(0, len(coordinates_lists) - 1):
        # Obtain the x and y coordinate values of the current image and the next image
        x = coordinates_lists[index][0]
        y = coordinates_lists[index][1]

        x1 = coordinates_lists[index + 1][0]
        y1 = coordinates_lists[index + 1][1]

        # View the difference between two points
        while len(x) < len(x1):
            diff = len(x1) - len(x)
            x = x + x[:diff]
            y = y + y[:diff]

        while len(x1) < len(x):
            diff = len(x) - len(x1)
            x1 = x1 + x1[:diff]
            y1 = y1 + y1[:diff]

        # Calculation path
        x_path = np.array(x1) - np.array(x)
        y_path = np.array(y1) - np.array(y)

        for i in np.arange(0, n_frames + 1):
            # Calculate current position
            x_temp = (x + (x_path / n_frames) * i)
            y_temp = (y + (y_path / n_frames) * i)

            # Draw a chart
            fig, ax = plt.subplots(figsize=(6, 6), subplot_kw=dict(aspect="equal"))
            ax.set_facecolor(bg_color)
            plt.xticks([])  # Remove the x-axis
            plt.yticks([])  # Remove the y-axis
            plt.axis('off')  # Remove the coordinate axis

            plt.scatter(x_temp, y_temp, c=marker_color, s=marker_size)

            plt.xlim(0, 1000)
            plt.ylim(0, 1000)

            # Remove wireframe
            ax.spines['right'].set_visible(False)
            ax.spines['top'].set_visible(False)

            # Grid line
            ax.set_axisbelow(True)
            ax.yaxis.grid(color='gray', linestyle='dashed', alpha=0.7)
            ax.xaxis.grid(color='gray', linestyle='dashed', alpha=0.7)

            # Save picture
            filename = f'images/frame_{index}_{i}.png'

            if (i == n_frames):
                for i in range(5):
                    filenames.append(filename)

            filenames.append(filename)

            # preservation
            plt.savefig(filename, dpi=96, facecolor=bg_color)
            plt.close()
    print('Save chart\n')
    # Generate GIF
    print('generate GIF\n')
    with imageio.get_writer(f'{gif_name}.gif', mode='I') as writer:
        for filename in filenames:
            image = imageio.imread(filename)
            writer.append_data(image)
    print('preservation GIF\n')
    print('Delete picture\n')
    # Delete picture
    for filename in set(filenames):
        os.remove(filename)

    print('complete')


coordinates_lists = text_to_data('Python', repeat=True, intensity=50)

build_gif(coordinates_lists,
          gif_name='Python',
          n_frames=7,
          bg_color='#52A9F0',
          marker_color='#000000',
          marker_size=0.2)

Three main functions.
#Create a random list of x/y coordinates and filter them using mask.
get_masked_data()
#Convert text to data
text_to_data()
#Generate scatter plot, save with GIF
build_gif()
Of course, other graphics are also OK, that is, you need to draw by yourself.
The size of the picture should be 1000x1000 pixels, the mask should be colored black and the background should be white.
Then save the png file in the images/letters folder and name it with a single character.
coordinates_lists = text_to_data('mac_', repeat=True, intensity=50)

build_gif(coordinates_lists,
          gif_name='mac',
          n_frames=7,
          bg_color='#F5B63F',
          marker_color='#000000',
          marker_size=0.2)
The result is as follows. The last one is a figure.


 已为社区贡献126445条内容

所有评论(0)