
系统监控Prometheus之一Docker安装部署Prometheus
·

Prometheus 是什么
Prometheus是一款开源的系统监控与告警工具,由SoundCloud公司开发并捐赠给Cloud Native Computing Foundation(CNCF)。它具有以下核心特性:
- 多维数据模型(基于时间序列)
- 强大的查询语言(PromQL)
- 灵活的告警规则配置
- 原生支持服务发现
- 可视化界面(结合Grafana使用更佳)
该工具广泛应用于容器化环境和微服务架构的监控场景,能够有效收集和存储指标数据,并通过告警机制帮助运维团队快速发现问题。
核心组件
- Prometheus Server:核心,负责拉取、存储、查询与告警规则计算。
- Exporter:将第三方服务(如 MySQL、Redis、主机)指标转为 Prometheus 格式。
- PushGateway:接收短任务推送的指标,供 Server 拉取Prometheus。
- Alertmanager:处理告警、去重、抑制、通知Prometheus。
- Client Libraries:嵌入应用,暴露自定义业务指标。
典型指标类型
- Counter:只增不减(如 HTTP 请求总数、错误数)。
- Gauge:可增可减(如内存占用、CPU 使用率)。
- Histogram/Summary:统计分布(如接口响应延迟、请求耗时)。
生态与常用搭配
- 可视化:Grafana(构建仪表盘)。
- 长期存储:Thanos、Cortex、M3DB 等。
- 日志 / 链路:配合 Loki、Jaeger 实现 “监控 + 日志 + 链路” 全链路可观测。
使用的Docker命令
docker pull 获取镜像
如果我们本地没有 prometheus 镜像,我们可以使用 docker pull 命令来载入 prometheus 镜像:
$ docker pull prom/prometheus
docker run 启动容器
以下命令使用 prometheus 镜像启动一个容器,参数为以命令行模式进入该容器:
$ docker run -itd --name=prometheus --restart=always -p 9090:9090 prom/prometheus
安装步骤
1. 安装 Prometheus Server
通过 Docker 快速部署:
yangyanping@yangyaningdeAir bin % docker pull prom/prometheus
Using default tag: latest
latest: Pulling from prom/prometheus
0d1d799270c5: Pull complete
7938917f4b9d: Pull complete
ef445d38f2c6: Pull complete
a2f967955733: Pull complete
c2d2d0563ae3: Pull complete
1dccce9f415d: Pull complete
e5d54fbf8ee1: Pull complete
37404d8f503a: Pull complete
d23996ce6dd9: Pull complete
3cc769d96815: Pull complete
Digest: sha256:1f0f50f06acaceb0f5670d2c8a658a599affe7b0d8e78b898c1035653849a702
Status: Downloaded newer image for prom/prometheus:latest
docker.io/prom/prometheus:latest
yangyanping@yangyaningdeAir bin % mkdir -p /data/prometheus
yangyanping@yangyaningdeAir bin %
yangyanping@yangyaningdeAir bin %
yangyanping@yangyaningdeAir bin % docker run -itd --name=prometheus --restart=always -p 9090:9090 prom/prometheus
74602ea06c8cb54d67ee38c2ac58891cd5e76239cf4d34dab8d9f64510866e2c
yangyanping@yangyaningdeAir bin %
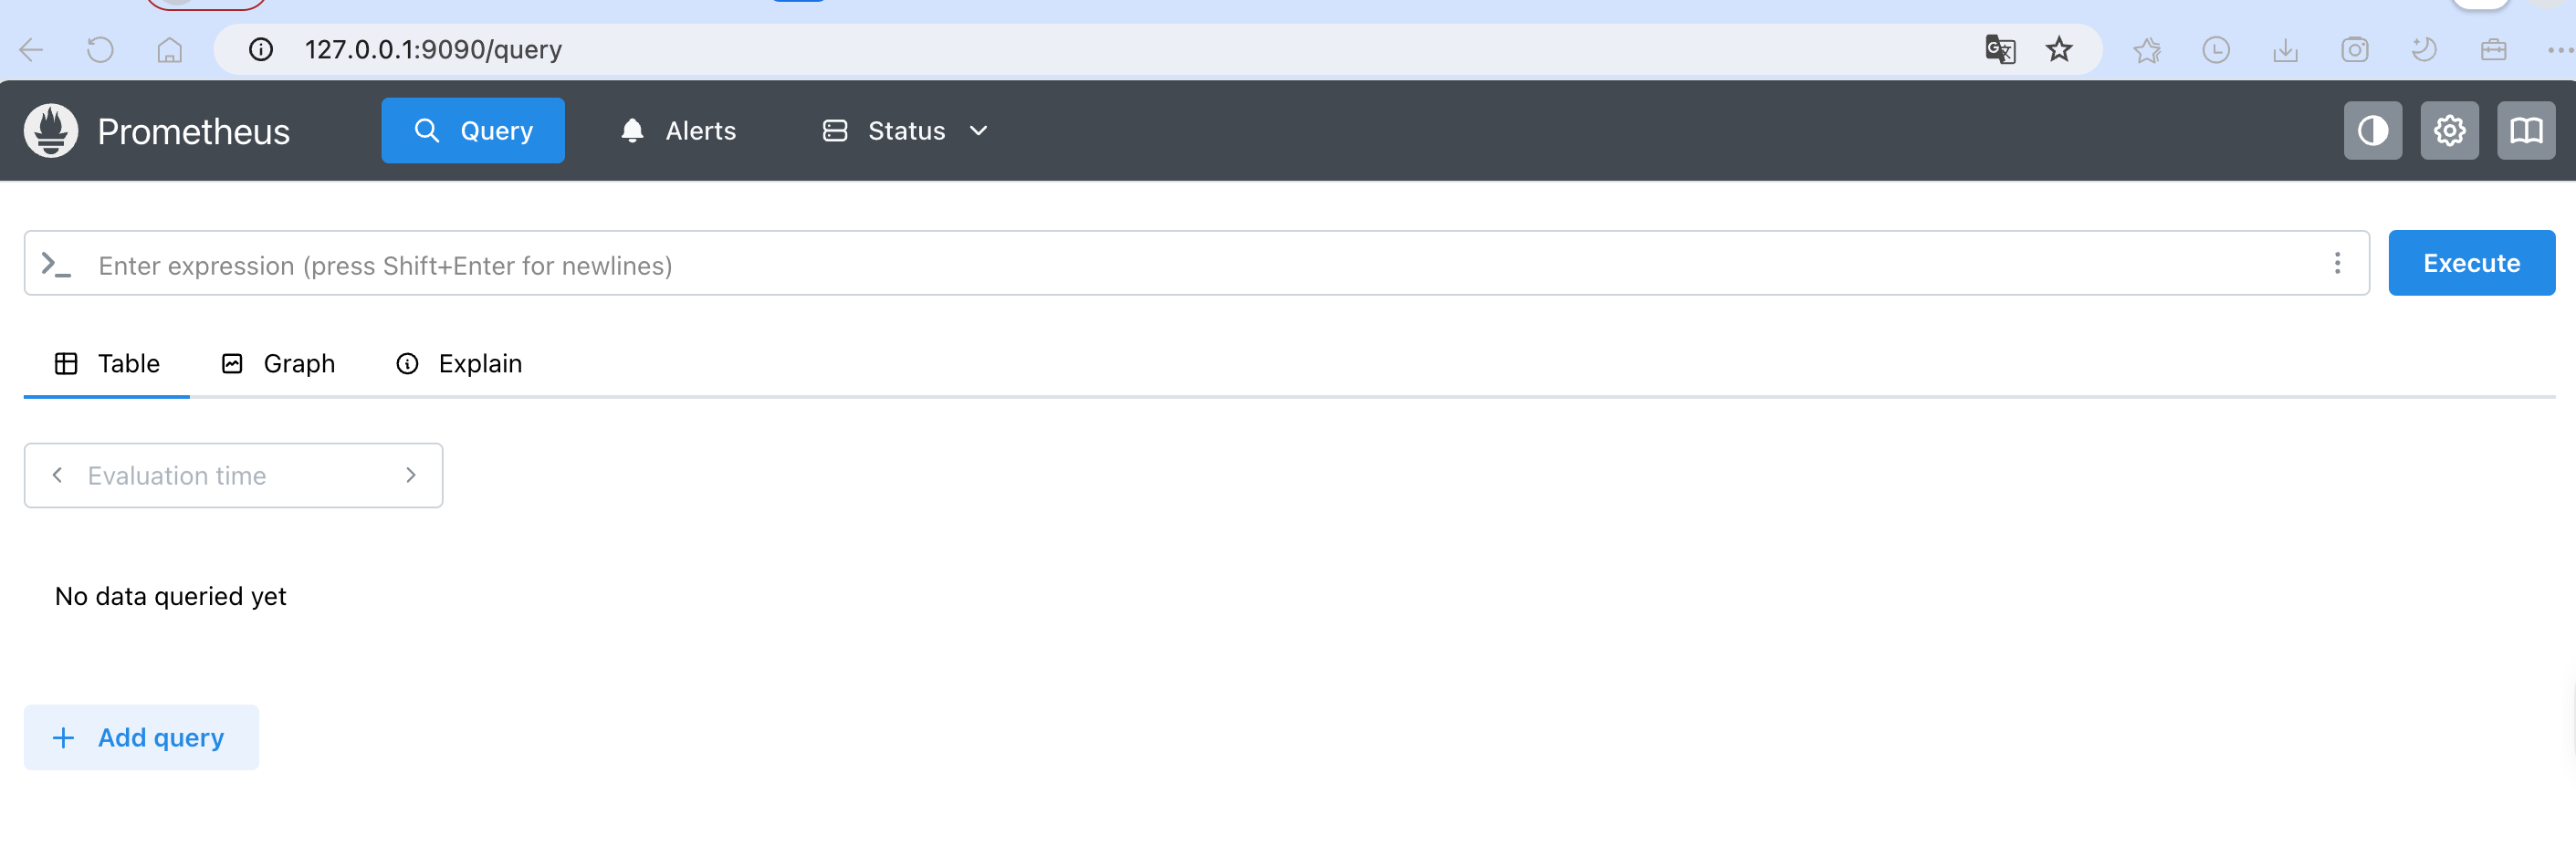
容器创建成功后,可通过 http://服务器IP:9100
2.安装 Grafana
Grafana 是一个跨平台开源的度量分析和可视化工具,可以通过将采集的数据查询后可视化展示,并支持及时通知。
默认账户密码:admin/admin
# 拉取镜像
yangyanping@yangyaningdeAir bin % docker pull grafana/grafana
Using default tag: latest
latest: Pulling from grafana/grafana
d8ad8cd72600: Pull complete
75c01d8d80b6: Pull complete
6a3f88e6196e: Pull complete
4f4fb700ef54: Pull complete
7b1a69e8b4bd: Pull complete
55b6a5e3acd3: Pull complete
c3549c1604e4: Pull complete
9a83ba4b179c: Pull complete
fabd13cce4d7: Pull complete
796e7a91af38: Pull complete
Digest: sha256:9e1e77ade304069aee3196e9a4f210830e96e80ce9a2640891eccc324b152faf
Status: Downloaded newer image for grafana/grafana:latest
docker.io/grafana/grafana:latest
# 启动容器
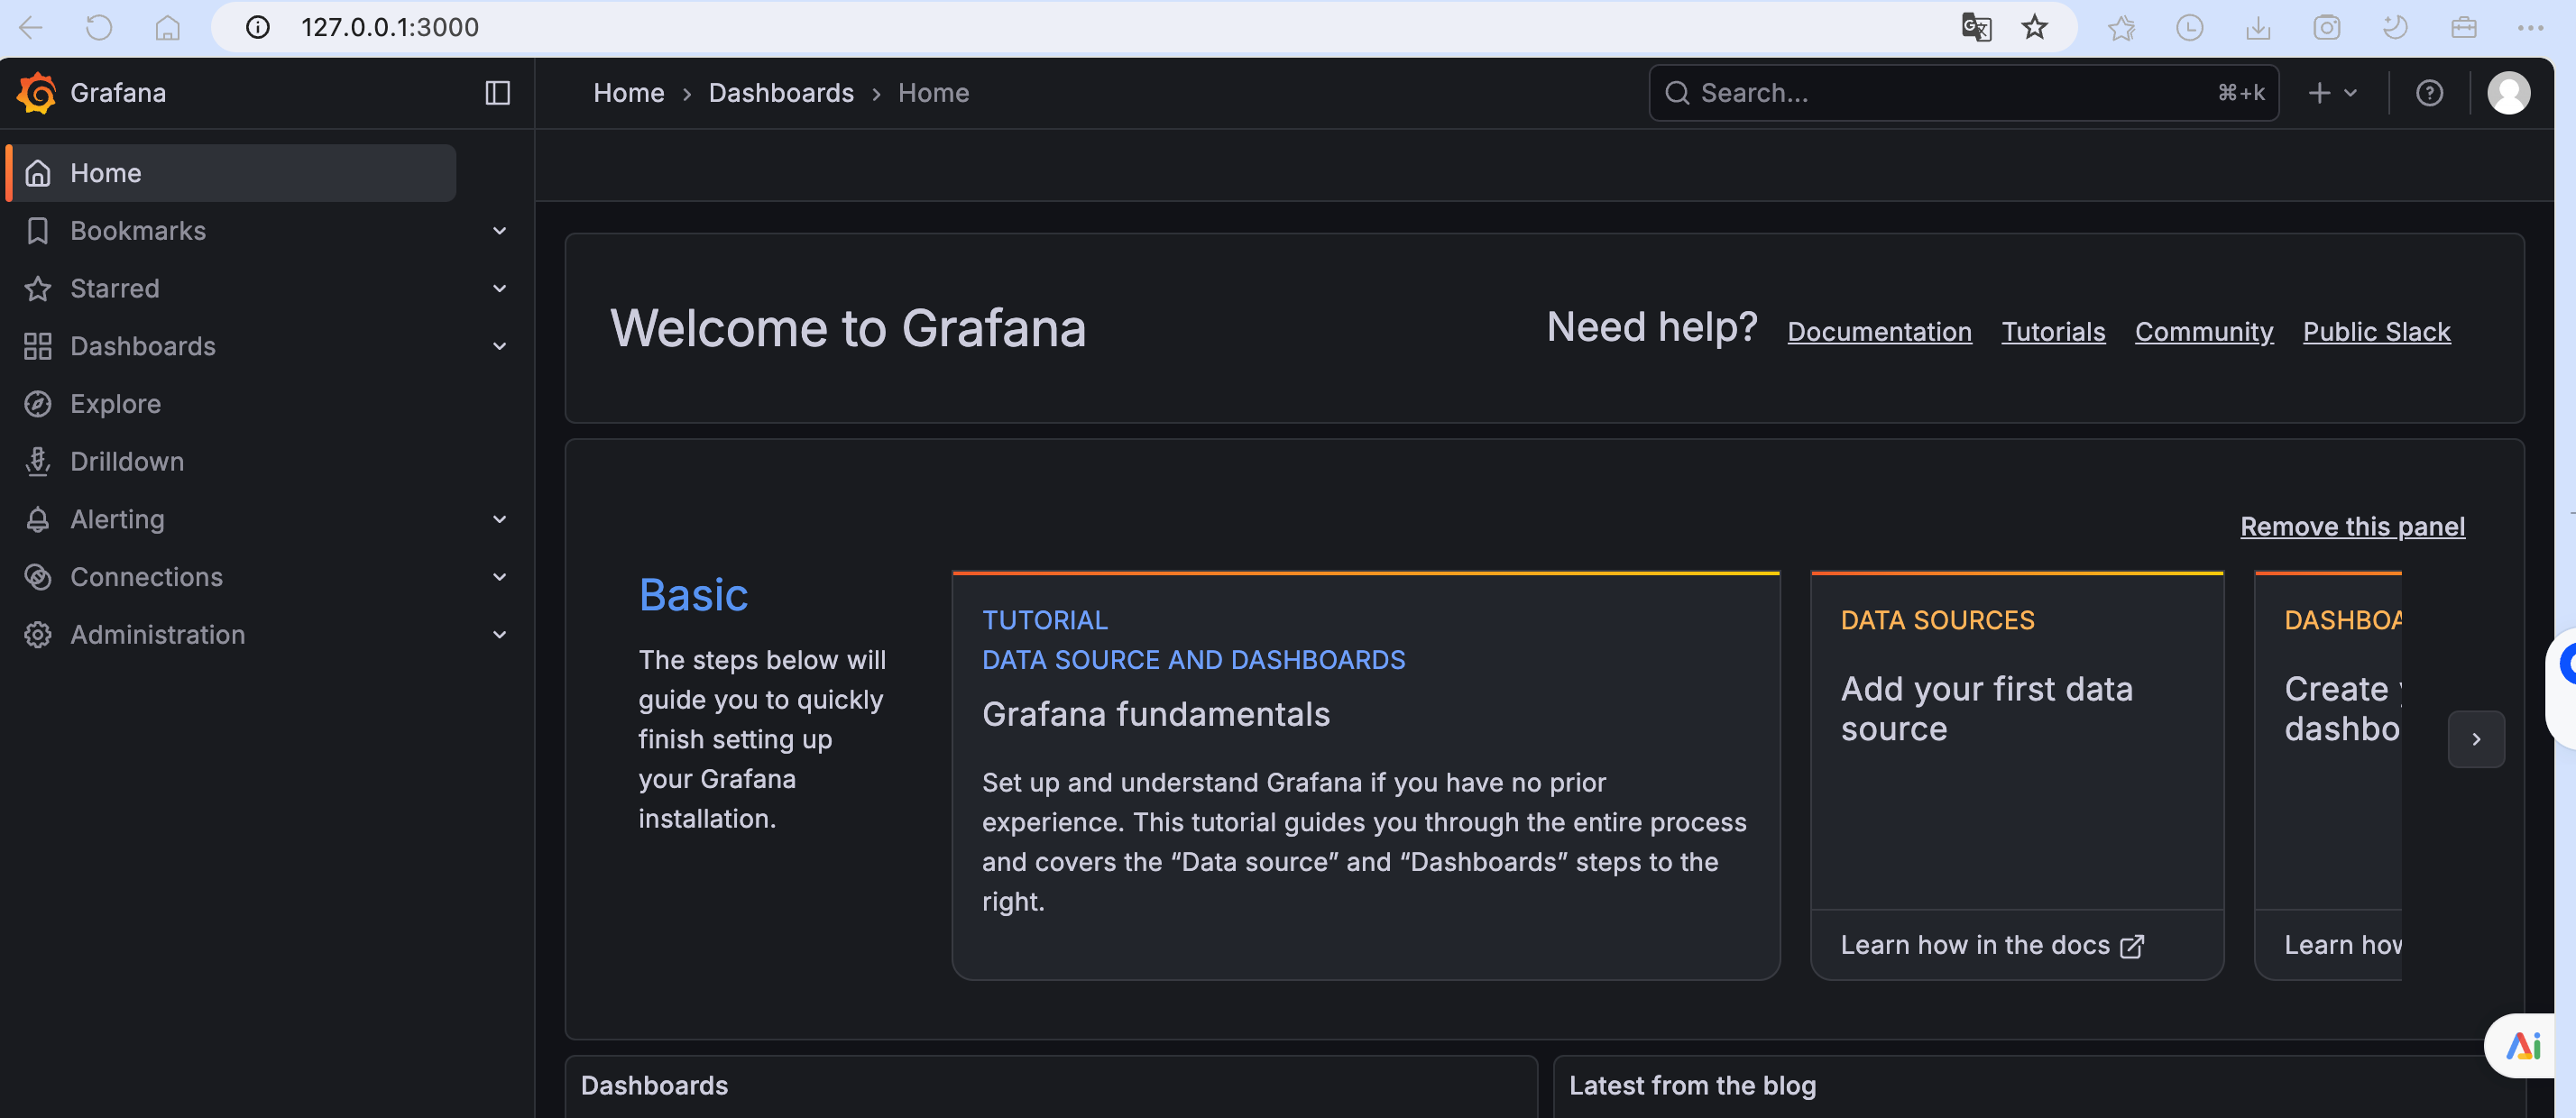
yangyanping@yangyaningdeAir bin % docker run -d --name=grafana -p 3000:3000 grafana/grafana
更多推荐

 4
4 0
0- 0


 已为社区贡献11条内容

所有评论(0)