
vue3+ts+echarts日期折线图
·
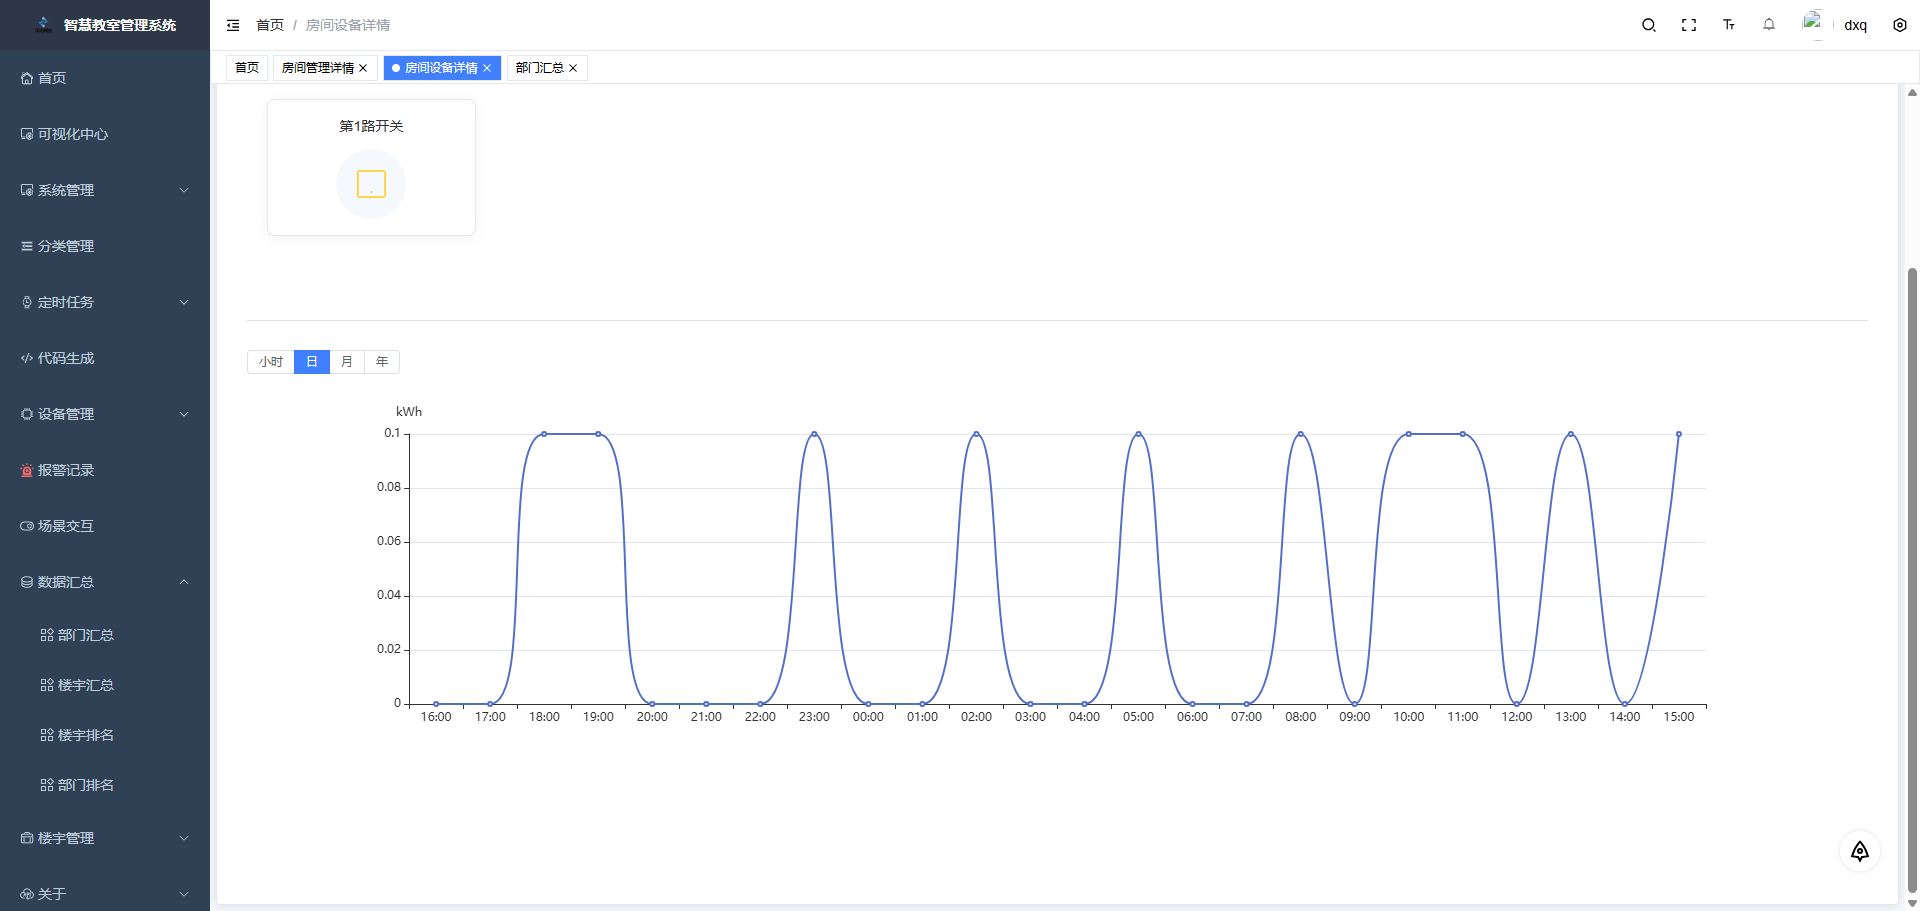
 <!-- 计量 -->
    <el-row v-if="deviceTypeId === '4' || deviceTypeId === '8'">
      <el-col :xs="24" :sm="24" :md="24" :lg="24" :xl="24">
        <div class="chart-container">
          <div class="filter-container">
            <el-radio-group v-model="timeType" size="small" @change="fetchMeasurementData">
              <el-radio-button label="hour">小时</el-radio-button>
              <el-radio-button label="day">日</el-radio-button>
              <el-radio-button label="month">月</el-radio-button>
              <el-radio-button label="year">年</el-radio-button>
            </el-radio-group>
          </div>
          <div id="chartRef" ref="chartRef" style=" width: 100%;height: 400px;" class="chart dianliang-chart"></div>
        </div>
      </el-col>
    </el-row>
// 计量
const timeType = ref<'day' | 'month' | 'year' | 'hour'>('day')
const selectedHour = ref<Date>(new Date())
const selectedDay = ref<Date>(new Date())
const selectedMonth = ref<Date>(new Date())
const selectedYear = ref<Date>(new Date())
const radarTimeType = ref<'day' | 'month' | 'year' | 'hour'>('day')
const radarSelectedHour = ref<Date>(new Date())
const radarSelectedDay = ref<Date>(new Date())
const radarSelectedMonth = ref<Date>(new Date())
const radarSelectedYear = ref<Date>(new Date())
const WenduTimeType = ref<'day' | 'month' | 'year' | 'hour'>('day')
const WenduSelectedHour = ref<Date>(new Date())
const WenduSelectedDay = ref<Date>(new Date())
const WenduSelectedMonth = ref<Date>(new Date())
const WenduSelectedYear = ref<Date>(new Date())
const chartRef = ref<HTMLElement | null>(null)
const radarRef = ref<HTMLElement | null>(null)
const wenduRef = ref<HTMLElement | null>(null)
// 计量图表数据
const chartXAxisData = ref<string[]>([])
const chartData = ref<number[]>([])
function fetchMeasurementData() {
  // 根据 timeType 和对应的日期选择,拼接 timeAmount 和 timeUnit
  let timeAmount = '1';
  let timeUnit = 'd';
  let date: Date = new Date();
  if (timeType.value === 'day') {
    timeUnit = 'd';
    date = selectedDay.value;
  } else if (timeType.value === 'month') {
    timeUnit = 'mo';
    date = selectedMonth.value;
  } else if (timeType.value === 'year') {
    timeUnit = 'y';
    date = selectedYear.value;
  } else if (timeType.value === 'hour') {
    timeUnit = 'h';
    date = selectedHour.value;
  }
  DashAPI.getMeasurement({
    // deviceCode: props.deviceCode,
    deviceCode: deviceCodeCS.value,
    timeAmount,
    timeUnit,
    roomId: roomId.value
  }).then(data => {
    // 确保数据存在且有效
    if (data && data.length > 0 && data[0] && data[0].time && data[0].value) {
      chartXAxisData.value = data[0].time;
      chartData.value = data[0].value;
      console.log("计量", data[0].time)
      // 使用 nextTick 确保 DOM 更新后再更新图表
      nextTick(() => {
        updateChart();
      });
    } else {
      console.warn("计量数据为空或格式不正确");
      // 如果数据为空,清空图表数据
      chartXAxisData.value = [];
      chartData.value = [];
      nextTick(() => {
        updateChart();
      });
    }
  }).catch(error => {
    console.error("获取计量数据失败", error);
    // 错误时清空数据并更新图表
    chartXAxisData.value = [];
    chartData.value = [];
    nextTick(() => {
      updateChart();
    });
  })
}
function updateChart() {
  function tryLight() {
    const chartDom = document.querySelector('.dianliang-chart');
    // 容器未准备好,递归等待
    if (!chartDom || chartDom.clientWidth === 0 || chartDom.clientHeight === 0) {
      requestAnimationFrame(tryLight);
      return;
    }
    // 每次都重新初始化,彻底避免缓存
    let myChart = echarts.getInstanceByDom(chartDom as HTMLElement);
    if (myChart) {
      myChart.clear();
      myChart.dispose();
    }
    myChart = echarts.init(chartDom as HTMLElement);

    const xAxisData = [...chartXAxisData.value];
    const data = [...chartData.value];

    const option = {
      xAxis: {
        type: 'category',
        data: xAxisData,
        axisLine: { lineStyle: { color: getTextColor() } },
        axisTick: { color: getTextColor() }
      },
      tooltip: {
        trigger: 'axis',
        axisPointer: { type: 'cross' }
      },
      yAxis: {
        type: 'value',
        name: 'kWh',
        axisPointer: { snap: true },
        axisLine: { show: true, lineStyle: { color: getTextColor() } },
        axisTick: { show: true, color: getTextColor() }
      },
      series: [
        {
          data: data,
          type: 'line',
          smooth: true
        }
      ]
    };
    myChart.setOption(option, { notMerge: true, replaceMerge: ['series', 'xAxis', 'yAxis'] });
    myChart.resize();
  }
  nextTick(() => {
    tryLight();
  });
}
更多推荐


 3
3 0
0- 0


 已为社区贡献2条内容

所有评论(0)