
Python爬取某联数据分析师岗位 + 词云可视化
·
近期在学习数据分析岗位的市场情况,于是用 DrissionPage + requests 爬取了某联上「数据分析师」的岗位数据,并用 pyecharts 做了可视化大屏。下面将完整代码+思路整理分享给大家!
一、整体思路
| ① 爬虫采集 | 使用 DrissionPage监听接口,不用自己分析请求。翻页采集30页, |
| ② 数据存储 | 写入 CSV 文件,包含公司信息、岗位要求、薪资等17个字段 |
| ③ 数据清洗 | 用 pandas 读取,去重,加字段,以薪资范围的开头作为薪资 |
| ④ 可视化 | jieba 分词 + 停用词过滤,词云图(岗位介绍 + 工作标签)+ 饼图 + 柱状图,组合成可拖拽大屏 |
二、环境准备
pip install DrissionPage pandas pyecharts jieba三、完整采集代码
import csv

from DrissionPage import ChromiumPage
from time import sleep
import pandas as pd
from datetime import datetime
import random

start_time = datetime.now()
# 创建保存文件
filename = f"数据分析师采集开始时间{start_time.strftime('%Y%m%d%H%M%S')}.csv"
f = open(filename, mode='w', encoding='utf-8-sig', newline='')
# 写入表头
csv_write = csv.DictWriter(f, fieldnames=[
    "公司名称",
    "公司类型",
    "公司规模",
    "公司行业",
    "岗位发布时间",
    "岗位名称",
    "学历要求",
    "要求工作时间",
    "薪资范围",
    "岗位类型",
    "岗位介绍",
    "工作内容标签",
    "工作地址",
    "工作详细地址",
    "招聘人",
    "招聘人岗位",
    "招聘人活跃状态"
])
csv_write.writeheader()


# 创建浏览器对象
dp = ChromiumPage()

"""
打开目标网址,一开始打开时,招聘信息是一个静态html,没有“positions?MmEwMD”接口信息
得点击其他页面后才会有positions?MmEwMD接口信息
"""
# 监听数据接口
dp.listen.start("positions?MmEwMD")
dp.get("招聘网址url")

"""
找到上一页按钮,点击,让网页返回"positions?MmEwMD"接口信息
定位class时,开头得用css: .代表查找class ele代表返回第一个匹配的,eles代表返回全部
# tags = dp.eles('css:.soupager a')
# print(tags)
# tags = dp.ele('css:.soupager a')
# print(tag)
"""

# print(dp.ele('css:.soupager a'), type(dp.ele('css:.soupager a')))
# print(dp.eles('css:.soupager a')[-1], type(dp.eles('css:.soupager a')[-1]))
# 回到第一页
dp.scroll.to_bottom()
sleep(1)
dp.ele('css:a.soupager__btn__before').click()
out_data = []
for i in range(1,31):
    print(f"正在采集{i}页内容")
    # 获取接口信息
    info = dp.listen.wait()
    response = info.response.body
    position_list = response["data"]["list"]
    dict_list =[]
    for position in position_list:
        jobDetailData = position["jobDetailData"]
        staffCard = position["staffCard"]
        dict = {
            "公司名称": position["companyName"],
            "公司类型": position["propertyName"],
            "公司规模": position["companySize"],
            "公司行业": position["industryName"],
            "岗位发布时间": position["publishTime"],
            "岗位名称": jobDetailData["position"]["base"]["positionName"],
            "学历要求": jobDetailData["position"]["base"]["education"],
            "要求工作时间": jobDetailData["position"]["base"]["positionWorkingExp"],
            "薪资范围": jobDetailData["position"]["base"]["salary"],
            "岗位类型": jobDetailData["position"]["base"]["workType"],
            "岗位介绍": jobDetailData["position"]["desc"]["description"],
            "工作内容标签": jobDetailData["position"]["desc"]["labels"],
            "工作地址": jobDetailData["position"]["workLocation"]["address"],
            "工作详细地址": jobDetailData["position"]["workLocation"]["workAddress"],
            "招聘人": staffCard["staffName"],
            "招聘人岗位": staffCard["hrJob"],
            "招聘人活跃状态": staffCard["hrStateInfo"]
        }
        print(dict)
        dict_list.append(dict)
        csv_write.writerow(dict)
    out_data += dict_list
    # 翻页
    dp.scroll.to_bottom()
    dp.ele("css:.soupager a:last-of-type").click()
    # dp.eles('css:.soupager a')[-1].click()

    sleep(round(random.uniform(1,2), 1))
end_time = datetime.now()
print(end_time-start_time)
踩坑点:打开页面后是静态HTML,必须先点击一次其他页面,才会触发接口,后续才能正常监听。
四、可视化代码
import pandas as pd
import jieba
from pyecharts.charts import Pie, Bar, WordCloud
from pyecharts import options as opts
from pyecharts.charts import Page
# 读取文件
df = pd.read_csv('数据分析师采集开始时间20260531154434.csv', encoding="utf-8-sig")
# 数据预处理
df2 = df.drop_duplicates(subset=["公司名称", "岗位发布时间", "岗位名称"]).copy()
df2[["地区", "街道"]] = df2["工作地址"].str.replace("工作地点:", "").str.split(" · ", expand=True)
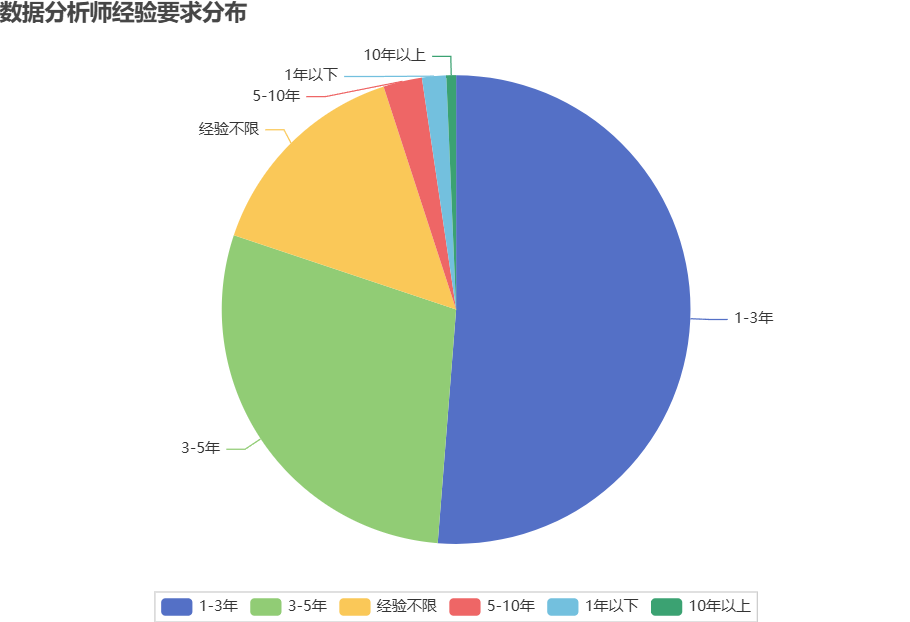
experience = df2["要求工作时间"].value_counts()
experience_x = experience.index.to_list()
experience_y = experience.to_list()
data = list(zip(experience_x, experience_y))
pie1 = (
Pie()
.add("", data)
.set_global_opts(
title_opts=opts.TitleOpts(title="数据分析师经验要求分布"),
legend_opts=opts.LegendOpts(
pos_bottom="0", # ✅ 贴底
orient="horizontal" # ✅ 横向排列(可选)
))
)
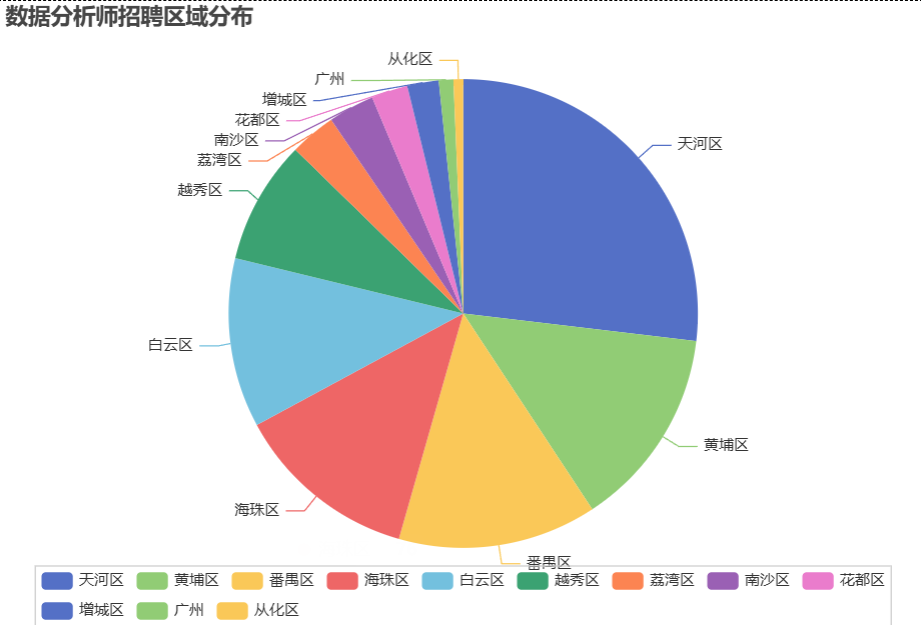
address = df2["地区"].value_counts()
address_x = address.index.to_list()
address_y = address.to_list()
data = list(zip(address_x, address_y))
pie2 = (
Pie()
.add("", data)
.set_global_opts(title_opts=opts.TitleOpts(title="数据分析师招聘区域分布"),
legend_opts=opts.LegendOpts(
pos_bottom="0", # ✅ 贴底
orient="horizontal" # ✅ 横向排列(可选)
))
)
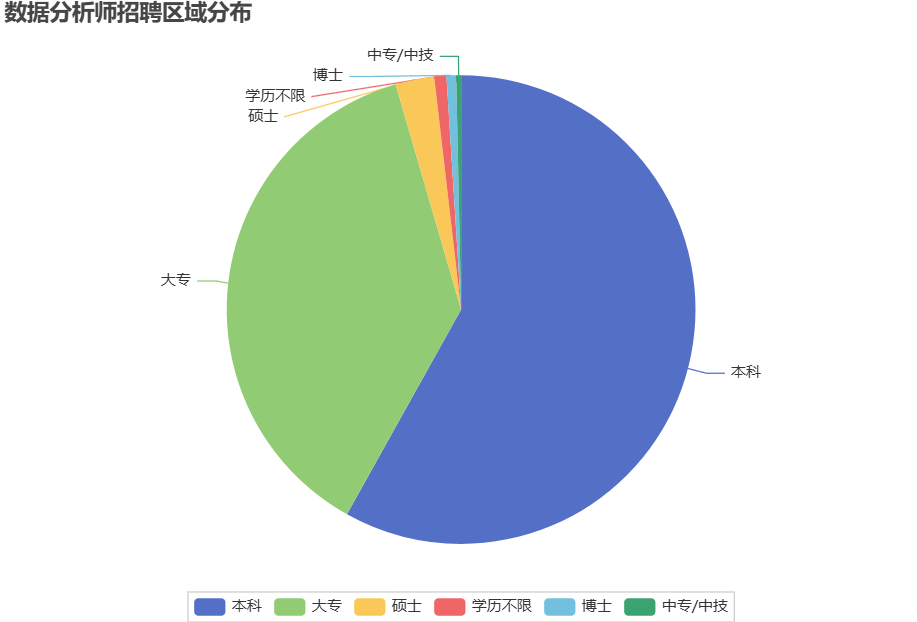
education = df2["学历要求"].value_counts()
education_x = education.index.to_list()
education_y = education.to_list()
data = list(zip(education_x, education_y))
pie3 = (
Pie()
.add("", data)
.set_global_opts(title_opts=opts.TitleOpts(title="数据分析师招聘区域分布"),
legend_opts=opts.LegendOpts(
pos_bottom="0", # ✅ 贴底
orient="horizontal" # ✅ 横向排列(可选)
))
)
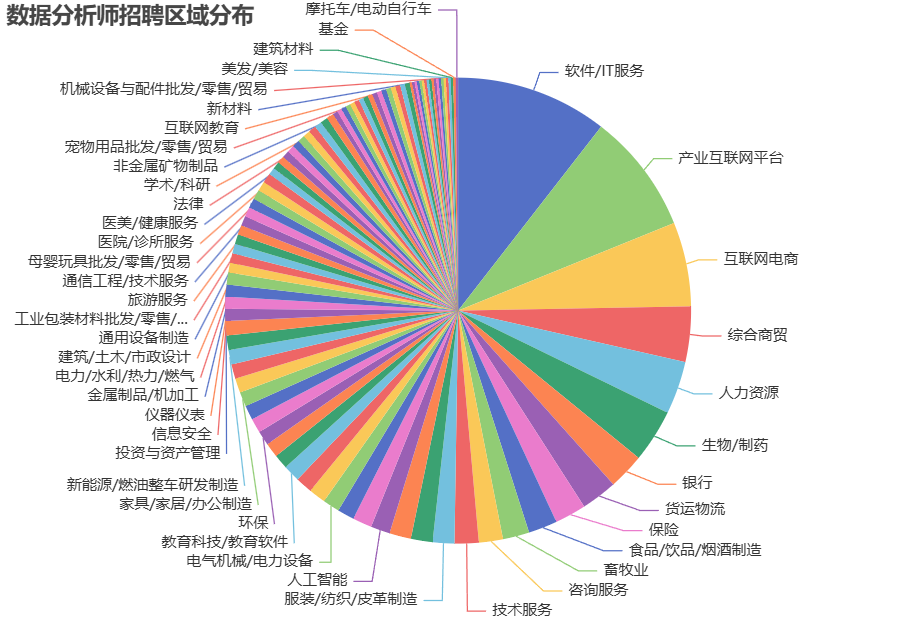
industry = df2["公司行业"].value_counts()
industry_x = industry.index.to_list()
industry_y = industry.to_list()
data = list(zip(industry_x, industry_y))
pie4 = (
Pie()
.add("", data)
.set_global_opts(
title_opts=opts.TitleOpts(title="数据分析师招聘区域分布"),
legend_opts=opts.LegendOpts(
is_show=False,
pos_bottom="0", # ✅ 贴底
orient="horizontal" # ✅ 横向排列(可选)
))
)
def transform(s):
salary = 0
flag = 1 if "万" in str(s) else 0
if flag:
salary = float(str(s).split("-")[0]) * 10000
else:
if "天" in str(s):
salary = float(str(s).split("-")[0]) * 20
elif "面议" in str(s):
salary = 0
else:
salary = float(str(s).split("-")[0])
return salary
salary_df = df2[["薪资范围"]].copy()
salary_df["薪资"] = salary_df["薪资范围"].apply(lambda x: transform(x))
salary_df = salary_df.loc[salary_df["薪资"] != 0, :]
salary = salary_df["薪资"].value_counts().sort_index(ascending=False)
print(salary_df["薪资"].describe())
categories = salary.index.to_list()
values = salary.to_list()
# 数据
bar = (
Bar()
.add_xaxis(categories) # ✅ X轴:类目
.add_yaxis("数量", values) # ✅ Y轴:值
.set_global_opts(
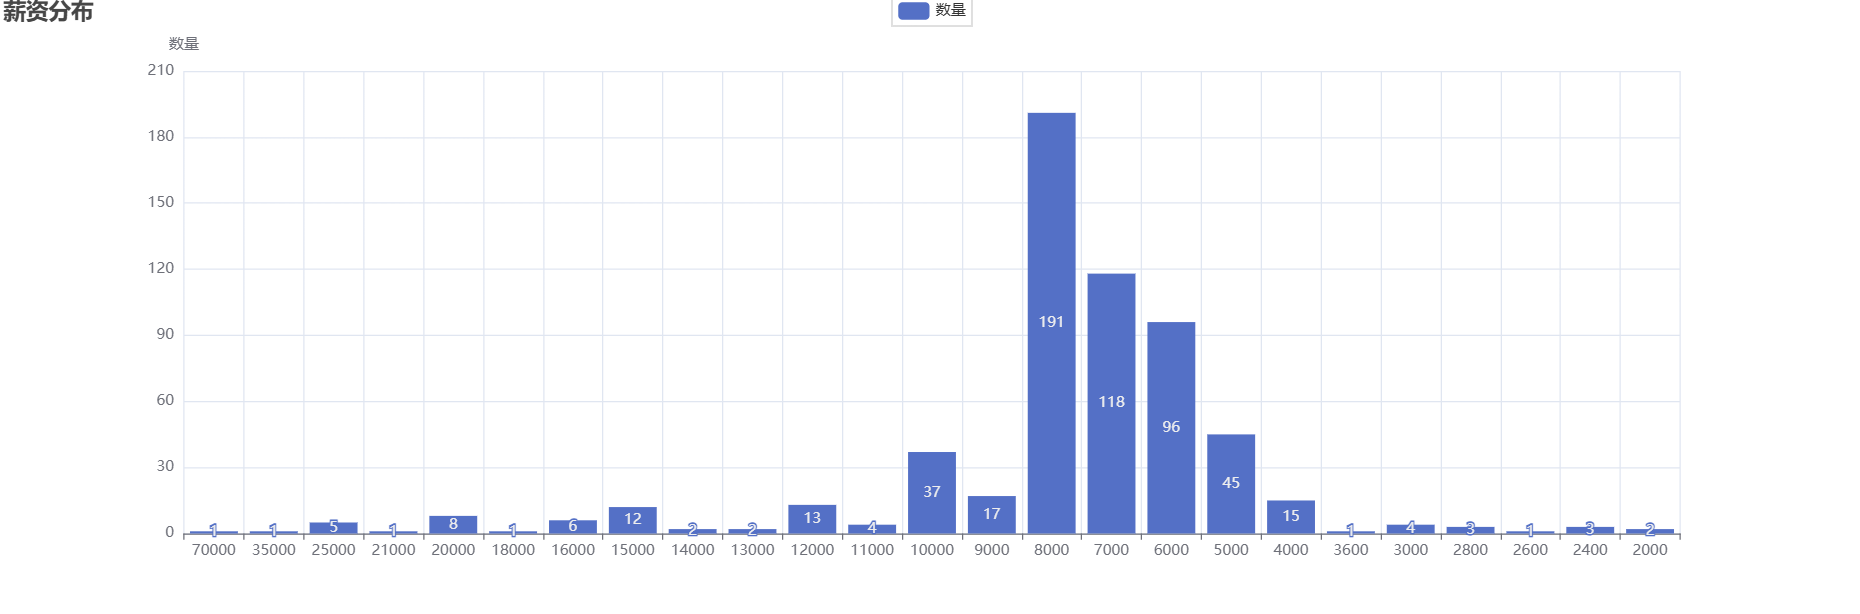
title_opts=opts.TitleOpts(title="薪资分布"),
yaxis_opts=opts.AxisOpts(name="数量"),
)
)
stopwords_ch = [
'的', '了', '在', '是', '我', '有', '和', '就', '不', '人', '都', '一', '一个',
'上', '也', '很', '到', '说', '要', '去', '你', '会', '着', '没有', '看', '好',
'自己', '这', '他', '她', '它', '们', '那', '些', '什么', '怎么', '哪', '谁',
'为', '与', '及', '或', '但', '而', '被', '把', '让', '给', '从', '向', '对',
'以', '因', '所', '如', '比', '更', '最', '还', '已', '又', '再', '能', '可以',
'这个', '那个', '这些', '那些', '这样', '那样', '怎么', '如何', '为什么', '多少',
'一些', '一点', '一下', '之后', '之前', '里面', '外面', '上面', '下面', '时候',
'因为', '所以', '虽然', '但是', '如果', '虽然', '不过', '只是', '就是', '还是',
'啊', '呀', '吧', '吗', '呢', '哦', '嗯', '哈', '嘛', '啦', '哎', '哟', '喔',
'地', '得', '着', '过', '来', '去', '起来', '出来', '进来', '回去', '上来', '下去',
'等等', '之类', '什么', '怎样', '那样', '这里', '那里', '哪里', '哪儿', '多少',
'每', '各', '某', '另', '其他', '其余', '整个', '所有', '任何', '一切', '大家',
'没有', '并非', '不是', '别', '勿', '莫', '未', '没', '甭'
]
stopwords_en = [
"a", "about", "above", "after", "again", "against", "all", "am", "an", "and",
"any", "are", "aren't", "as", "at", "be", "because", "been", "before", "being",
"below", "between", "both", "but", "by", "can't", "cannot", "could", "couldn't",
"did", "didn't", "do", "does", "doesn't", "doing", "don't", "down", "during",
"each", "few", "for", "from", "further", "get", "got", "had", "hadn't", "has",
"hasn't", "have", "haven't", "having", "he", "he'd", "he'll", "he's", "her",
"here", "here's", "hers", "herself", "him", "himself", "his", "how", "how's",
"i", "i'd", "i'll", "i'm", "i've", "if", "in", "into", "is", "isn't", "it",
"it's", "its", "itself", "let's", "me", "more", "most", "mustn't", "my", "myself",
"no", "nor", "not", "of", "off", "on", "once", "only", "or", "other", "ought",
"our", "ours", "ourselves", "out", "over", "own", "same", "shan't", "she",
"she'd", "she'll", "she's", "should", "shouldn't", "so", "some", "such", "than",
"that", "that's", "the", "their", "theirs", "them", "themselves", "then", "there",
"there's", "these", "they", "they'd", "they'll", "they're", "they've", "this",
"those", "through", "to", "too", "under", "until", "up", "very", "was", "wasn't",
"we", "we'd", "we'll", "we're", "we've", "were", "weren't", "what", "what's",
"when", "when's", "where", "where's", "which", "while", "who", "who's", "whom",
"why", "why's", "with", "won't", "would", "wouldn't", "you", "you'd", "you'll",
"you're", "you've", "your", "yours", "yourself", "yourselves", "div", "ui", "li"
]
content = df2["岗位介绍"]
text = " ".join(content)
words = [word for word in jieba.cut(text) if
(word not in stopwords_ch) and (word not in stopwords_en) and len(word) > 1]
freq = {}
for w in words:
# freq.get(w, 0),如果取不到对应的值,则赋值为0
freq[w] = freq.get(w, 0) + 1
sorted_items = sorted(freq.items(), key=lambda x: x[1], reverse=True)
data = sorted_items[:100]
wordcloud1 = (
WordCloud()
.add("", data, word_size_range=[20, 100], shape="circle")
.set_global_opts(title_opts=opts.TitleOpts(title="岗位介绍词云图"))
# .render("wordcloud.html")
)
content = df2["工作内容标签"]
text = " ".join(content)
words = [word for word in jieba.cut(text) if
(word not in stopwords_ch) and (word not in stopwords_en) and len(word) > 1]
freq = {}
for w in words:
# freq.get(w, 0),如果取不到对应的值,则赋值为0
freq[w] = freq.get(w, 0) + 1
sorted_items1 = sorted(freq.items(), key=lambda x: x[1], reverse=True)
data = sorted_items1[:100]
wordcloud2 = (
WordCloud()
.add("", data, word_size_range=[20, 100], shape="circle")
.set_global_opts(title_opts=opts.TitleOpts(title="工作内容标签词云图"))
# .render("wordcloud.html")
)
# ✅ 组合成一个页面
page = Page(layout=Page.DraggablePageLayout) # 可拖拽布局
page.add(pie1, pie2, pie3, pie4, bar, wordcloud1, wordcloud2)
page.render("智联招聘数据分析岗位可视化-一页charts.html")
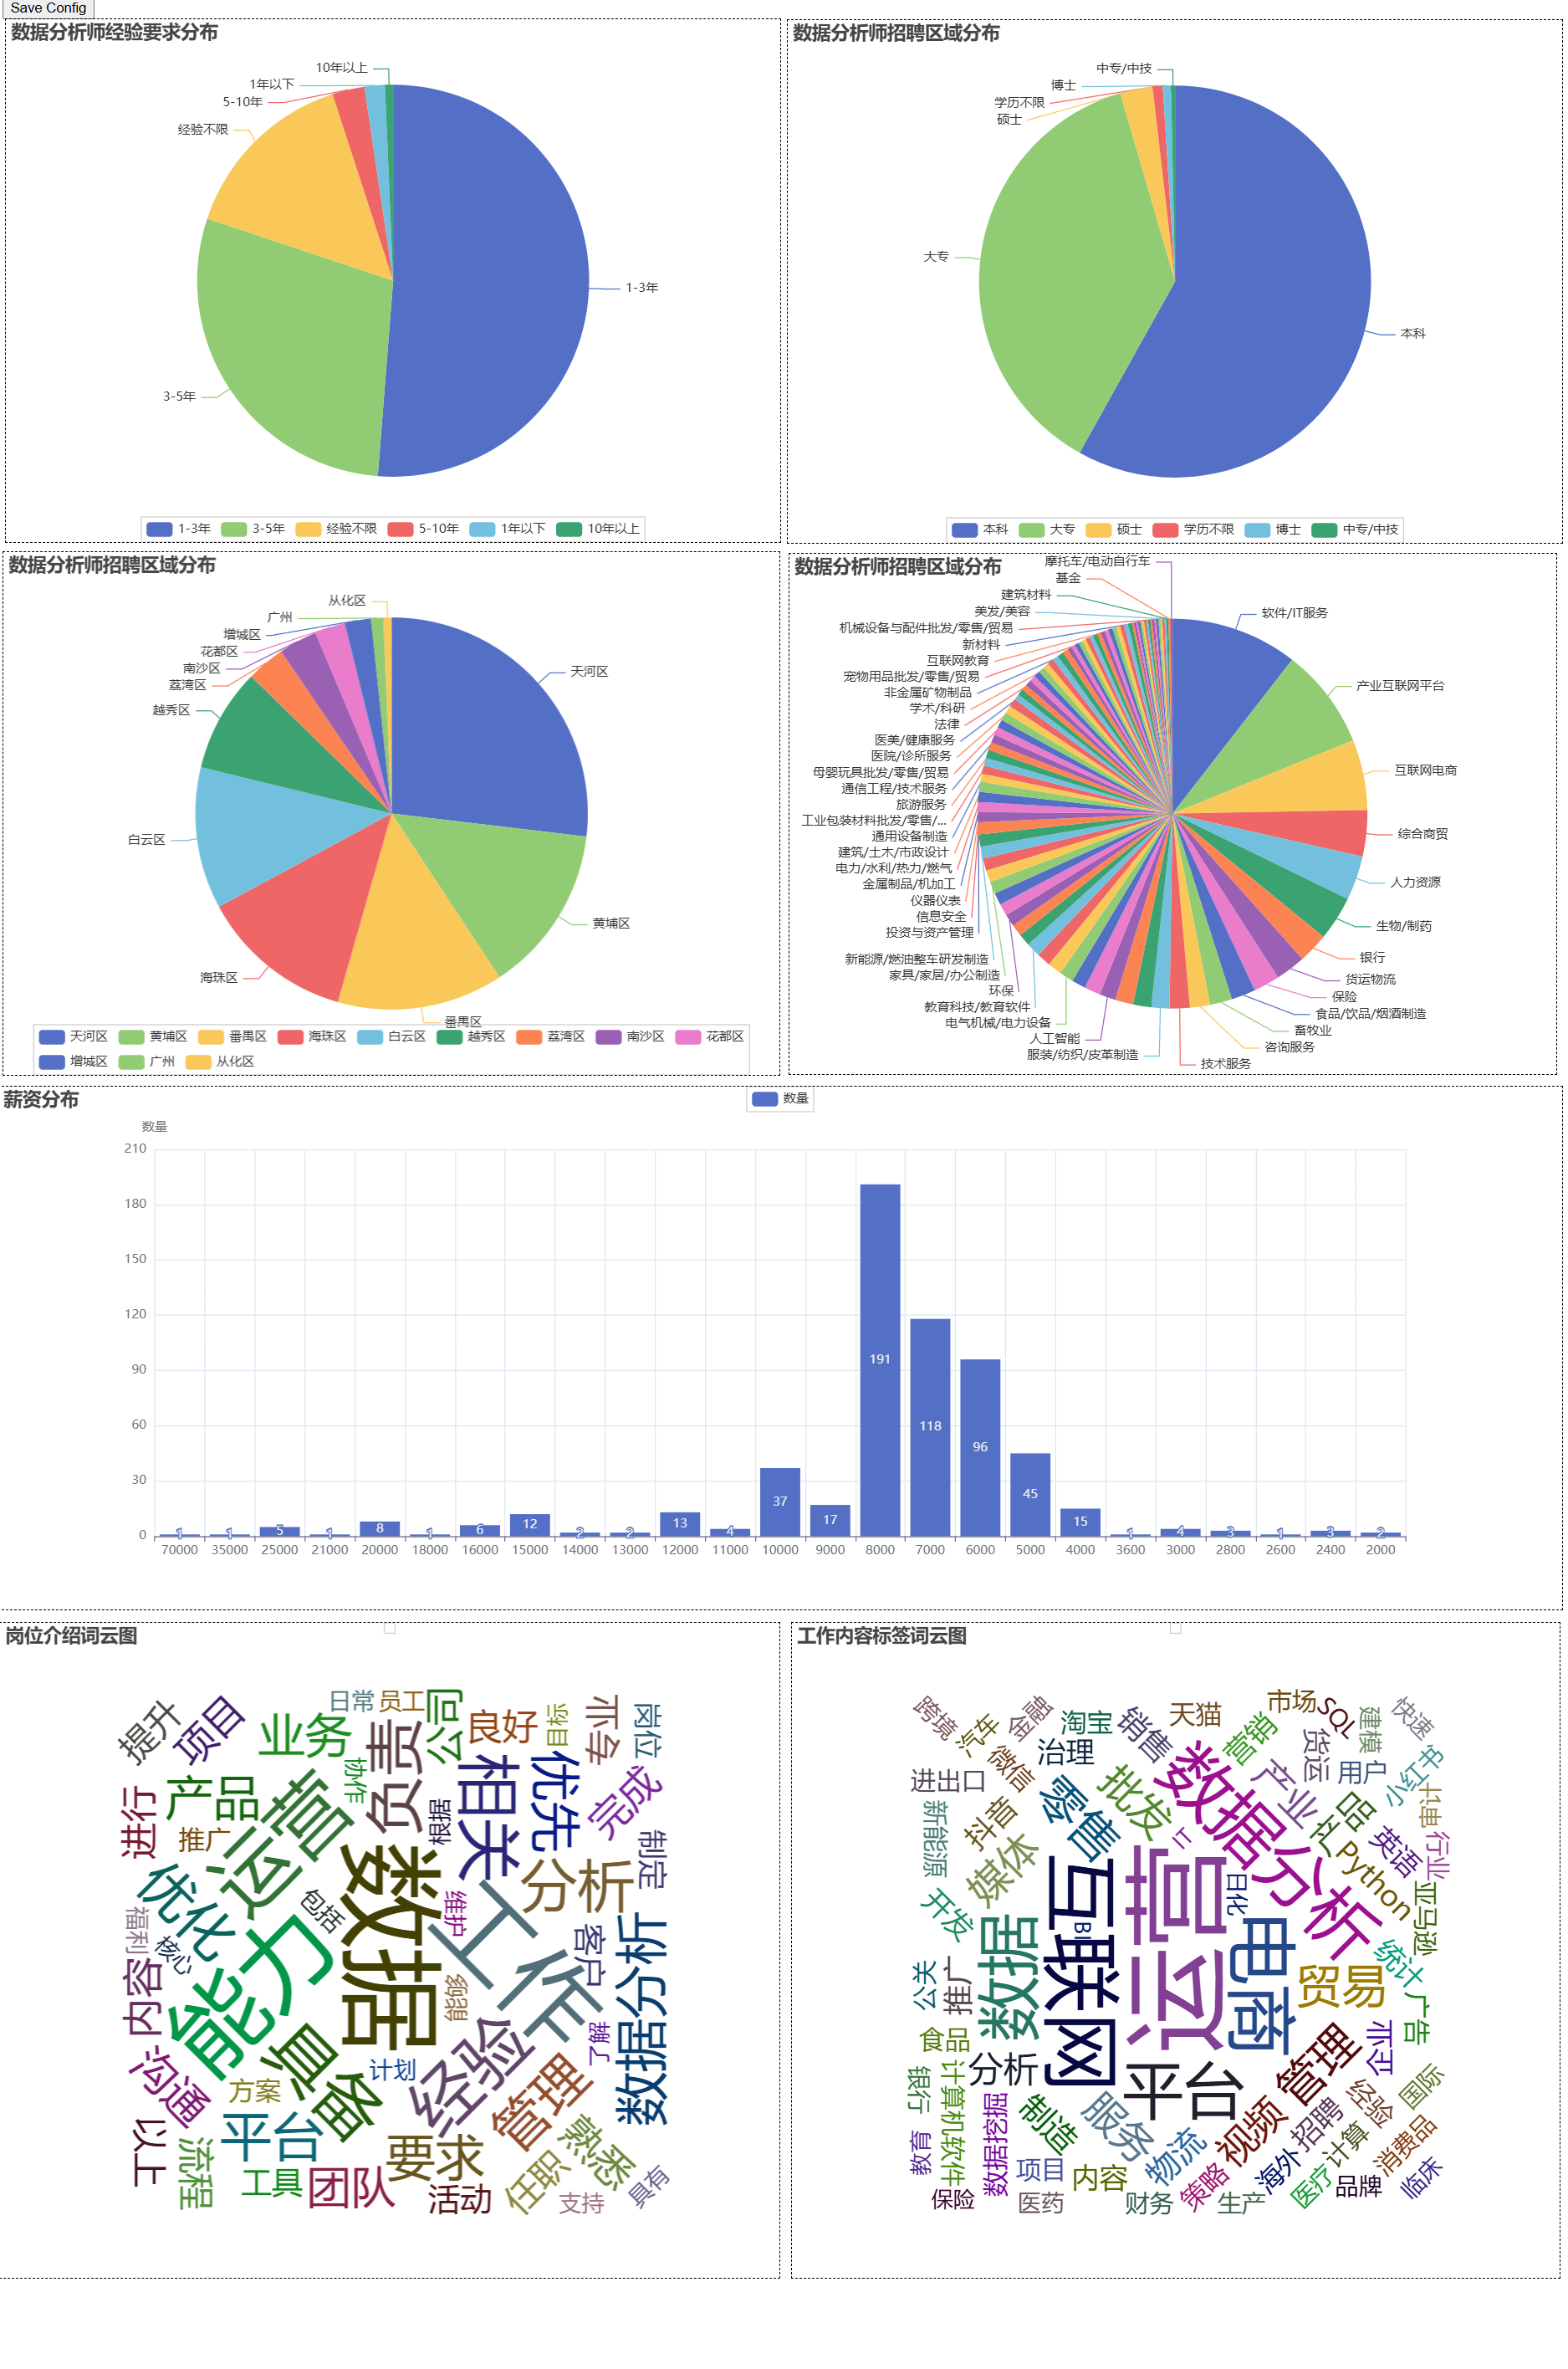
五、最终效果


| 📊 采集总数 |
约600条岗位数据 |
| 🥧 经验要求 | 一半左右岗位要求1-3年工作经验约 |
| 🥧 学历要求饼图 | 本科、大专占比超过80% |
| 🥧 公司行业Top3 | IT服务、互联网、电商 |
| 💰 薪资中位数 | 8000 |
| 🏷️ 高频技能词 | "SQL""、Python"、"BI" |
| ☁️ 标签词云 | "数据分析"、"运营"、"经验"、"能力" |
六、注意事项
| 页面初始无接口数据 | 先点击一次翻页按钮,触发接口包 |
| 中文乱码 | CSV 用 utf-8-sig 编码 |
| 薪资清洗 | 统一转为元单位,取区间起始值 |
| 停用词过滤 | 中英文停用词表 + 长度>1 过滤 |
| 词云重叠 | 取 TOP100 高频词,shape="circle" 圆形布局 |
更多推荐
 15
15 0
0- 0


 已为社区贡献2条内容

所有评论(0)