
c#图表控件及图表库
A。WinForm Chart图表控件:
https://blog.csdn.net/fangyuan621/article/details/139374014
https://blog.csdn.net/lvxingzhe3/article/details/139684728
https://www.cnblogs.com/baozi789654/p/14349851.html
https://www.cnblogs.com/baozi789654/p/13981492.html
https://www.cnblogs.com/baozi789654/p/14534774.html
https://blog.csdn.net/qq_38693757/article/details/125513359
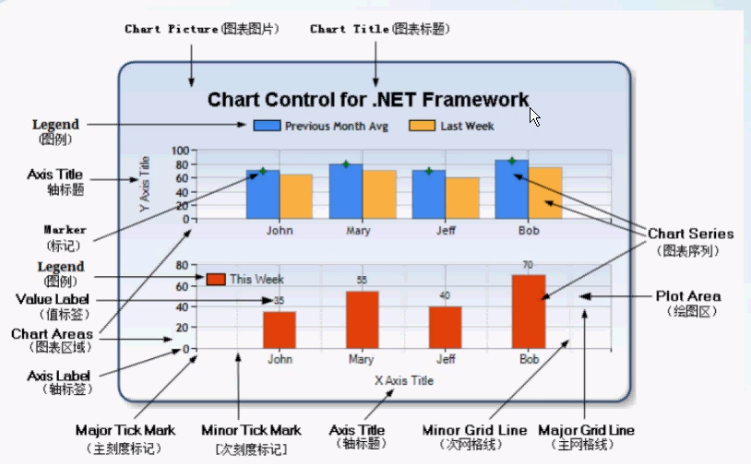
官方图表控件Chart重要的组成部分:
ChartAreas属性:绘图区,可以有多个,每个区域可以绘制不同的图形,如:柱状图(Column, Bar),饼状图,线性图等 ****
Series属性:序列,即绘制的图形 ***
Legends属性:图例,一般用来解释某个序列的意思。注解 ***
Titles:图表标题集合,设置图表的标题 ***
图表的数据(从数据库来)****
轴(两个轴标题,两个轴轴标签,值标签,放到值标签时提示, 网格线,标签样式(文字,边框))
图表的外观(调色板Palette,自定义属性CustomProperties)
图表类型(ChartType)
官方图表控件Chart应用步骤:
1。拖控件
2。设数据
3。更改属性
Chart控件绑定数据两种方式:
1。通过DataBindXY()
chart1.Series["Series1"].Points.DataBindXY(XList, YList);
chart1.Series[0].Points.DataBind(list, "X", "Y", null);
2。通过DataSource
chart1.DataSource = result;
chart1.Series[0].XValueMember = "CategoryName";
chart1.Series[0].YValueMembers = "Num";
B。C# WinForm中图表库:LiveCharts及LiveCharts2、ScottPlot.NET、OxyPlot,推荐使用LiveCharts2
1. LiveCharts:可以应用到多个平台,如:WinForm、WPF等
https://github.com/beto-rodriguez/LiveCharts2
LiveCharts2官网:https://livecharts.dev/
LiveCharts官网:https://v0.lvcharts.com/
2. ScottPlot.NET:
https://scottplot.net/
3. OxyPlot实时曲线:
https://oxyplot.github.io/
https://gitee.com/electronic-diy-studio/OxyPlotWinform
C。LiveCharts2应用:
https://blog.csdn.net/weixin_40314351/article/details/130219993
https://blog.csdn.net/weixin_47195090/article/details/145139645
D。LivCharts应用:
https://blog.csdn.net/weixin_45114627/article/details/141065953
1。LiveCharts2 是什么?
LiveCharts2 是一个简单、灵活、交互式以及功能强大的跨平台图表库。
LiveCharts是一个.net的数据可视化库,可以跨多个设备和框架运行,
它在MIT许可证下运行(免费),并提供了一个付费包来提高性能和扩展功能。
LiveCharts2 现在几乎可以运行在任何平台,支持Maui,Uno Platform、Avalonia、Etoforms、Xamarin、Blazor-wasm、WPF、Winforms、WinUI、UWP等。
LiveCharts2 是LiveCharts(0)的升级,它修复了前身的主要设计问题,专注于在任何地方运行,在不丢失V0中已有的特性情况下提高了灵活性。
2。LiveCharts2 可以做什么?
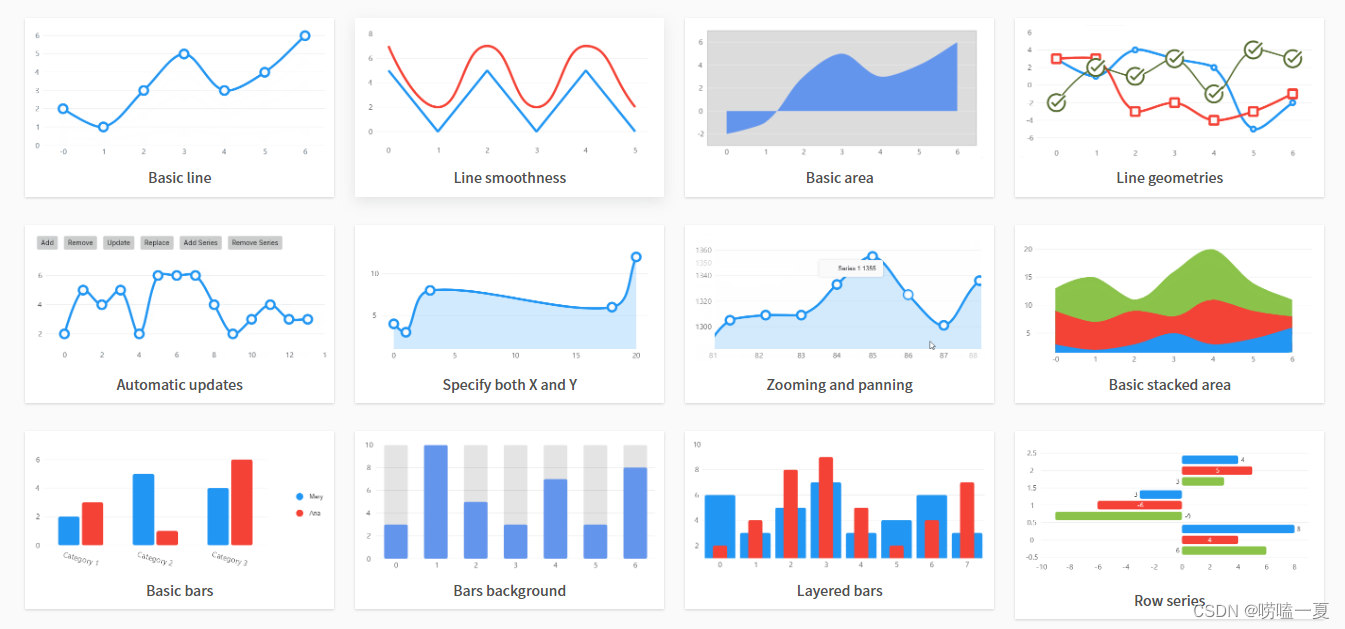
LiveCharts2 提供了折线图、饼图、柱状图、散点图、面积图等多种类型的图表。此外,它还支持多个图表联动显示,支持动态更新数据、自定义样式和动画效果等功能。
可参考:【livechart2可绘制的图类型.png】
3。怎么使用?
a. 创建一个.net framework版本/.net core(出现版本不兼容问题)的winform项目
b. 安装LiveChartsCore.SkiaSharpView.WinForms类库
c. 抄文档。
贝塞尔曲线:
https://cubic-bezier.com/#.16,.93,.82,.35
缓动函数
using _1.官方图表.Models;
using System;
using System.Collections.Generic;
using System.Drawing;
using System.Windows.Forms;
using System.Windows.Forms.DataVisualization.Charting;

namespace _1.官方图表
{
    public partial class Form1 : Form
    {
        public Form1()
        {
            InitializeComponent();
        }

        private void Form1_Load(object sender, EventArgs e)
        {
            cht1();
            cht2();
            cht3();
        }


        // A. 给图表绑定数据源,第一种方式的三种写法:DataBind()
        private void cht1()
        {
            // IEnumerable
            List<int> listY = new List<int>() { 1, 2, 3, 4, 5 };
            //chart1.Series["Series1"].Points.DataBindY(listY);

            List<string> listX = new List<string>() { "张三", "李四", "王五", "赵六", "孙七" };
            //chart1.Series[0].Points.DataBindXY(listX, listY);

            List<Person> list = new List<Person>() {
                new Person(){ Id=1,Name="张三", Age=18,Percent=20},
                new Person(){ Id=2,Name="李四", Age=18,Percent=40},
                new Person(){ Id=3,Name="王五", Age=18,Percent=30},
                new Person(){ Id=4,Name="赵六", Age=18,Percent=10},
            };
            chart1.Series[0].Points.DataBind(list, "Name", "Age", null);


            chart1.Titles.Add("title1");

            chart1.Titles[0].Text = "第一个图标题";
            chart1.Titles[0].ForeColor = Color.Red;

            chart1.Legends[0].Title = "图例标题";
            chart1.Series[0].LegendText = "人名";

            // 特殊关键字:#VAL, #VALX, #VALY, #PERCENT,#TOTAL, #SERIESNAME等
            chart1.Series[0].Label = "#VAL";                //设置显示X Y的值
            chart1.Series[0].Label = "#VALY";                //设置显示X Y的值
            //chart1.Series[0].Label = "#SERIESNAME";                //设置显示X Y的值

            chart1.Series[1].Points.DataBind(list, "Name", "Percent", null);
            chart1.Series[1].Label = "#VALX";
            chart1.Series[1].ToolTip = "#VALX:#VALY";
        }


        // B. 给图表绑定数据源,第二种写法:DataSource
        private void cht2()
        {
            List<Person> list = new List<Person>() {
                new Person(){ Id=1,Name="张三", Percent=20},
                new Person(){ Id=2,Name="李四", Percent=40},
                new Person(){ Id=3,Name="王五", Percent=30},
                new Person(){ Id=4,Name="赵六", Percent=10},
            };
            chart2.DataSource = list;  // 数据源
            chart2.Series[0].XValueMember = "Name";  // X轴
            chart2.Series[0].YValueMembers = "Percent";  // Y轴
        }

        private void cht3()
        {
            chart3.Series.Add("Series2");
            chart3.Series.Add("Series3");
            chart3.Series[1].ChartType = SeriesChartType.Spline;
            chart3.Series[2].ChartType = SeriesChartType.Spline;


            List<Person> list = new List<Person>() {
                new Person(){ Id=1,Name="张三",Age=20,Score=60,Percent=20},
                new Person(){ Id=2,Name="李四",Age=10,Score=40,Percent=40},
                new Person(){ Id=3,Name="王五",Age=50,Score=80,Percent=30},
                new Person(){ Id=4,Name="赵六",Age=30,Score=50,Percent=10},
            };
            chart3.DataSource = list;  // 数据源
            chart3.Series[0].XValueMember = "Name";  // X轴
            chart3.Series[0].YValueMembers = "Age";  // Y轴

            //chart3.Series[1].XValueMember = "Name";  // X轴
            chart3.Series[1].YValueMembers = "Score";  // Y轴

            //chart3.Series[2].XValueMember = "Name";  // X轴
            chart3.Series[2].YValueMembers = "Percent";  // Y轴

            chart3.ChartAreas[0].AxisX.Title = "X轴标题";
            chart3.ChartAreas[0].AxisY.Title = "Y轴标题";
            chart3.Series[0].Label = "#VALY";
            chart3.Series[1].Label = "#VALY";
            chart3.Series[2].Label = "#VALY";

            chart3.ChartAreas[0].AxisX.MajorGrid.Enabled = true;
            chart3.ChartAreas[0].AxisY.MajorGrid.Enabled = true;

            chart3.ChartAreas[0].AxisX.MajorGrid.LineColor = Color.Red;
            chart3.ChartAreas[0].AxisY.MajorGrid.LineColor = Color.Blue;


            chart3.ChartAreas[0].AxisX.TitleForeColor = Color.Red;
            chart3.ChartAreas[0].AxisX.TextOrientation = TextOrientation.Auto;

            chart3.ChartAreas[0].AxisX.LabelStyle.Angle = 90;
            chart3.ChartAreas[0].AxisX.LabelStyle.Font = new Font("微软雅黑", 9f, FontStyle.Regular);
            chart3.ChartAreas[0].AxisX.LabelStyle.ForeColor = Color.Red;
        }
    }
}
using System;
using System.Windows.Forms;

namespace _2.斯克特曲线
{
    public partial class Form1 : Form
    {
        public Form1()
        {
            InitializeComponent();
        }

        private void Form1_Load(object sender, EventArgs e)
        {
            double[] dataX = { 1, 2, 3, 4, 5 };
            double[] dataY = { 1, 4, 9, 16, 25 };

            formsPlot1.Plot.Title("Hello World");

            formsPlot1.Plot.Add.Scatter(dataX, dataY);
            formsPlot1.Refresh();


            double[] values = { 5, 2, 8, 4, 8 };  // 27  5/27
            var pie = formsPlot2.Plot.Add.Pie(values);  // pie图表
            /*pie.ExplodeFraction = .1;
            // hide unnecessary plot components
            formsPlot2.Plot.Axes.Frameless();
            formsPlot2.Plot.HideGrid();*/
            formsPlot2.Refresh();


        }

        private void button1_Click(object sender, EventArgs e)
        {
            formsPlot1.Plot.SavePng("quickstart.png", 400, 300);
        }
    }
}
补充:
了解一下主流3个设计模式:
MVP WindowForm code-behind代码在后面,代码在设计器的后面,所见即所得。
MVC Web项目 Java Web, 前端Vue, React等,asp.net, php。
MVVM WPF,Web项目,从MVC进化过来的
Model 模型,本质上数据
View 视图,本质上界面
Presenter 呈现器 充当“桥梁”,负责两部分工作:1。把模型中存储的数据渲染到视图。2。把视图搜集的信息再存储到模型。
Model 模型,本质上数据
View 视图,本质上界面
Control 控制器 充当“桥梁”,负责两部分工作:1。把模型中存储的数据渲染到视图。2。把视图搜集的信息再存储到模型。
Model 模型,本质上数据
View 视图,本质上界面
ModelView 模型视图 充当“桥梁”,负责两部分工作:1。把模型中存储的数据渲染到视图。2。把视图搜集的信息再存储到模型。
LiveChart2 版本2.0.5版本支持.net core。.net framework不能显示图表,是官方更新问题。
使用LiveChart2步骤:
1。安装LiveChartsCore.SkiaSharpView.WinForms,一次性。
2。创建图表实例,并添加到窗体上。(某种图表, 注意标题,图例,序列)
3。修改数据源(序列Series)
4。修改外观(细节,各种属性,查文档)
更多推荐
 6
6 0
0- 0


 已为社区贡献9条内容

所有评论(0)