Vue echarts雷达图各种样式更改
对echarts雷达图简单的样式更改
·


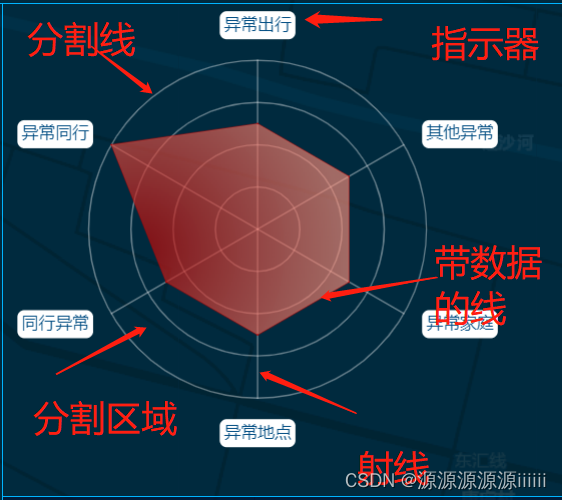
左边的是在echarts里找的样式,右边是经过修改后的样式
echarts的代码
option = {
  color: ['#67F9D8', '#FFE434', '#56A3F1', '#FF917C'],
  title: {
    text: 'Customized Radar Chart'
  },
  legend: {},
  radar: [
    {
      indicator: [
        { text: 'Indicator1' },
        { text: 'Indicator2' },
        { text: 'Indicator3' },
        { text: 'Indicator4' },
        { text: 'Indicator5' }
      ],
      center: ['25%', '50%'],
      radius: 120,
      startAngle: 90,
      splitNumber: 4,
      shape: 'circle',
      axisName: {
        formatter: '【{value}】',
        color: '#428BD4'
      },
      splitArea: {
        areaStyle: {
          color: ['#77EADF', '#26C3BE', '#64AFE9', '#428BD4'],
          shadowColor: 'rgba(0, 0, 0, 0.2)',
          shadowBlur: 10
        }
      },
      axisLine: {
        lineStyle: {
          color: 'rgba(211, 253, 250, 0.8)'
        }
      },
      splitLine: {
        lineStyle: {
          color: 'rgba(211, 253, 250, 0.8)'
        }
      }
    },
    {
      indicator: [
        { text: 'Indicator1', max: 150 },
        { text: 'Indicator2', max: 150 },
        { text: 'Indicator3', max: 150 },
        { text: 'Indicator4', max: 120 },
        { text: 'Indicator5', max: 108 },
        { text: 'Indicator6', max: 72 }
      ],
      center: ['75%', '50%'],
      radius: 120,
      axisName: {
        color: '#fff',
        backgroundColor: '#666',
        borderRadius: 3,
        padding: [3, 5]
      }
    }
  ],
  series: [
    {
      type: 'radar',
      emphasis: {
        lineStyle: {
          width: 4
        }
      },
      data: [
        {
          value: [100, 8, 0.4, -80, 2000],
          name: 'Data A'
        },
        {
          value: [60, 5, 0.3, -100, 1500],
          name: 'Data B',
          areaStyle: {
            color: 'rgba(255, 228, 52, 0.6)'
          }
        }
      ]
    },
    {
      type: 'radar',
      radarIndex: 1,
      data: [
        {
          value: [120, 118, 130, 100, 99, 70],
          name: 'Data C',
          symbol: 'rect',
          symbolSize: 12,
          lineStyle: {
            type: 'dashed'
          },
          label: {
            show: true,
            formatter: function (params) {
              return params.value;
            }
          }
        },
        {
          value: [100, 93, 50, 90, 70, 60],
          name: 'Data D',
          areaStyle: {
            color: new echarts.graphic.RadialGradient(0.1, 0.6, 1, [
              {
                color: 'rgba(255, 145, 124, 0.1)',
                offset: 0
              },
              {
                color: 'rgba(255, 145, 124, 0.9)',
                offset: 1
              }
            ])
          }
        }
      ]
    }
  ]
};
修改后的代码
 let mychart = echarts.init(document.getElementById("main"));
      let option = {
        color: ["#B50000"],
        radar: {
          indicator: this.echartsData.indicator, //指示器名称
          shape: 'circle', //原型是六边形,加了该字段为圆形
          splitNumber: 4, //里面有几个圆
          axisName: { //指示器样式
          color: '#004C82', //指示器的文字颜色
          lineHeight:20,//指示器行高
          borderRadius:5,//指示器圆角
          padding:[0,3,0,3],//指示器的内边距
          backgroundColor:'#fff'//指示器的背景颜色
          },
          splitLine:{ //里面四个圈线条样式
            lineStyle: {
              color: ['rgba(255, 255,255, 0.4)', 'rgba(255, 255,255, 0.4)', 'rgba(255, 255,255, 0.4)', 'rgba(255, 255,255, 0.4)'],//分别对应四个第一个对应最里面的圈
            }
            // show : false

          },
          axisLine: { //射线的样式
                      lineStyle:{
                        color: "rgba(255, 255,255, 0.4)",//射线的颜色
                      },
                    },
          splitArea: { //四个圈的分隔区域样式
                      areaStyle: {
                        color: ['rgba(119,234,223, 0)', 'rgba(38,195,190, 0)','rgba(100,175,233, 0)','rgba(66,139,212, 0)'],//分割区域的背景色
                        shadowColor: 'rgba(0, 0, 0, 0.2)',//分割区域阴影
                        shadowBlur: 10
                      }
                    },
          },

        series: [
          {
            type: "radar",
            data: [
              {
                value: this.echartsData.value,
                areaStyle: {
                  color: new echarts.graphic.RadialGradient(0.1, 0.6, 1, [
                    {
                      color: "#B50000",
                      offset: 0
                    },
                    {
                      color: "rgba(255, 145, 124, 0.9)",
                      offset: 1
                    }
                  ])
                }
              }
            ],
            lineStyle: {
              width: 1,
              opacity: 0.5
            },
            symbolSize: 1
          }
        ]
      };
      option && mychart.setOption(option);
代码里面都有注释,可以复制到自己的代码中进行样式调试
最常用的样式修改也就是线的修改,splitLine:分割线修改样式的属性,axisLine:射线修改样式的属性,splitArea:分割区域的样式,lineStyle:带有数的线样式修改

注意:我的图表内的指示器标题,以及value数据都是对象引入的,大家用的时候注意一下
更多推荐
 已为社区贡献1条内容


所有评论(0)