vue + echarts 大屏的各种组件使用方式 地图操作 图表操作等
下载下来的是一个geojson的文件,本质就是一个json,只不过存放的是地理信息,像经纬度,点线面的信息。在页面中使用echarts的api读取本地数据this.$echarts.registerMap("铁岭市", 你的存放路径);***目前免费下载的只支持国省市镇的区划边界,下钻到村一级就要使用付费的功能***这里写一个我遇到的需求:让页面上的图表具有不停的动画,看起来一直有数据变化的效果。


echarts官网:Apache ECharts
1.地图
再项目中引入echarts后,使用echarts展示地图
首先想要在echarts中展示,你需要准备地图的geojson格式的文件。
可以直接去阿里云的可视化平台上下载
下载下来的是一个geojson的文件,本质就是一个json,只不过存放的是地理信息,像经纬度,点线面的信息。下载下来的文件可以存放到数据库中,多层级可以制作地图下钻功能。目前测试我直接粘贴到项目中。直接读取本地文件。
***目前免费下载的只支持国省市镇的区划边界,下钻到村一级就要使用付费的功能***
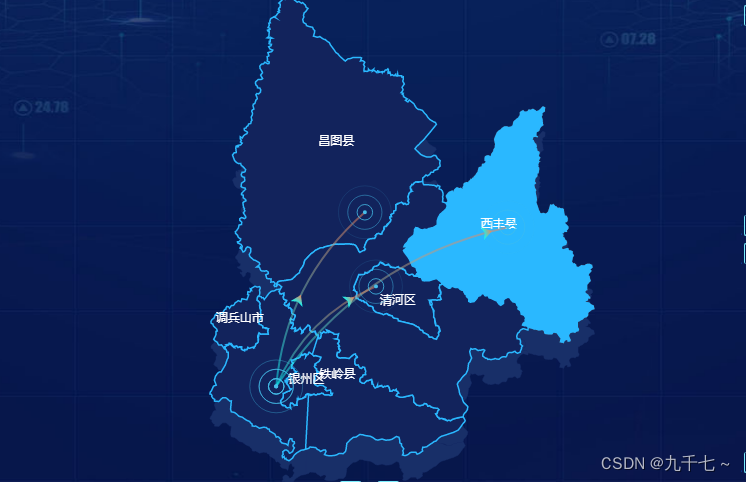
我测试下载的是铁岭市的geojson数据。
在页面中使用echarts的api读取本地数据this.$echarts.registerMap("铁岭市", 你的存放路径);
完整domo
<template>
	<div style="width: 100%;height: 100%;">
		<div id="mapTieling" style="width: 100%; height: 100%"></div>
	</div>
</template>

<script>
	import map_json from "../Geojson/data"; //本地存放路径
	export default {

		data() {
			return {

			}
		},
		mounted(){
			this.init()
		},
		methods: {
			async init() {

				let myChart = this.$echarts.init(document.getElementById("mapTieling"));

				this.$echarts.registerMap("铁岭市", map_json);

				myChart.setOption({
					geo: {
						map: "铁岭市", //此处名称一定要对应读取本地文件时自定义的名称
						roam: false,
						zoom: 1.2, 缩放等级
						center: [124.135372, 42.702495], // 当前视角的中心点

						itemStyle: {
							normal: {
								areaColor: "#1f51c4",
								shadowColor: "#182f68",
								shadowOffsetX: 0,
								shadowOffsetY: 25,
							},
							emphasis: {
								areaColor: "#2AB8FF",
								borderWidth: 0,
								color: "green",
								label: {
									show: false,
								},
							},
						},
						label: {
							show: true,
							distance: 5,
							textStyle: {
								color: "#fff",
								fontSize: 12,
								backgroundColor: "rgba(0,23,11,0)", // 字体背景色
							},
						},
					},
					series: [
						{
							type: "map",
							center: [124.135372, 42.702495], // 当前视角的中心点
							roam: false,
							label: {
								normal: {
									show: true,
									textStyle: {
										color: "#fff",
									},
									lineHeight: 20,
								},
								emphasis: {
									textStyle: {
										color: "#fff",
									},
								},
							},
							itemStyle: {
								normal: {
									borderColor: "#2ab8ff",
									borderWidth: 1.5,
									areaColor: "#12235c",
								},
								emphasis: {
									areaColor: "#2AB8FF",
									borderWidth: 0,
									color: "green",
								},
							},
							zoom: 1.2,
							map: "铁岭市", //使用
						},
					],
				});

				window.addEventListener("resize", () => {
					myChart.resize();
				});
			},
		},
	};
</script>

<style lang="less" scoped>

</style>
页面正常显示后就可以使用echarts的功能了,例如设置迁徙线
<template>
	<div style="width: 100%;height: 100%;">
		<div id="mapTieling" style="width: 100%; height: 100%"></div>
	</div>
</template>

<script>
	import map_json from "../Geojson/data";
	export default {

		data() {
			return {
				data:[
					{
						startingPointLongitude:"123.735372",
						startingPointLatitude:"42.229226",
						terminalPointLongitude:"124.117501",
						terminalPointLatitude:"42.792178",
					},
					{
						startingPointLongitude:"123.735372",
						startingPointLatitude:"42.229226",
						terminalPointLongitude:"124.733615",
						terminalPointLatitude:"42.744014",
					},{
						startingPointLongitude:"123.735372",
						startingPointLatitude:"42.229226",
						terminalPointLongitude:"124.165563",
						terminalPointLatitude:"42.552495",
					}
				],
				dataline:[],
				dataspot:[],
			}
		},
		mounted(){
			this.data.forEach(item => {
				this.dataline.push({
					coords: [
						[Number(item.startingPointLongitude), Number(item.startingPointLatitude)],
						[Number(item.terminalPointLongitude), Number(item.terminalPointLatitude)],
					],
				});
				this.dataspot.push({
					value: [Number(item.startingPointLongitude),Number(item.startingPointLatitude)],
				})
				this.dataspot.push({
					value: [Number(item.terminalPointLongitude),Number(item.terminalPointLatitude)],
				})
			})
			this.init()
		},
		methods: {
			async init() {

				let myChart = this.$echarts.init(document.getElementById("mapTieling"));

				this.$echarts.registerMap("铁岭市", map_json);

				myChart.setOption({
					geo: {
						map: "铁岭市",
						roam: false,
						// boxWidth: 48,
						// boxHeight: 100,
						zoom: 1.2,
						center: [124.135372, 42.702495], // 当前视角的中心点

						itemStyle: {
							normal: {
								areaColor: "#1f51c4",
								shadowColor: "#182f68",
								shadowOffsetX: 0,
								shadowOffsetY: 25,
							},
							emphasis: {
								areaColor: "#2AB8FF",
								borderWidth: 0,
								color: "green",
								label: {
									show: false,
								},
							},
						},
						label: {
							show: true,
							distance: 5,
							textStyle: {
								color: "#fff",
								fontSize: 12,
								backgroundColor: "rgba(0,23,11,0)", // 字体背景色
							},
						},
					},
					series: [
						{
							name: "地点",
							type: "effectScatter",
							coordinateSystem: "geo",
							zlevel: 2,
							rippleEffect: {
								//涟漪特效
								brushType: "stroke", //波纹绘制方式 stroke,fill
								period: 5, //动画时间,值越小速度越快
								scale: 15, //波纹圆环最大显示,值越大波纹越大
							},
							label: {
								emphasis: {
									show: true,
									position: "right",
									formatter: "{b}",
								},
							},
							symbolSize: 4,
							showEffectOn: "render",
							itemStyle: {
								normal: {
									color: "#46bee9",
								},
							},
							data: this.dataspot,
						},
						{
							name: "线路",
							type: "lines",
							coordinateSystem: "geo",
							zlevel: 2,
							large: true,
							effect: {
								show: true,
								constantSpeed: 30,
								symbol: "arrow", //arrow箭头图标,pin 圆点
								symbolSize: 10, //图标大小
								trailLength: 0, //特效尾迹长度[0,1]值越大,尾迹越长重
							},
							lineStyle: {
								normal: {
									color: new this.$echarts.graphic.LinearGradient(
										0,
										0,
										0,
										1,
										[{
												offset: 0,
												color: "#F58158",
											},
											{
												offset: 1,
												color: "#00FFFF",
											},
										],
										false
									),
									width: 2, //尾迹线条宽度
									opacity: 0.5, //尾迹线条透明度
									curveness: 0.2, //尾迹线条曲直度
								},
							},
							data: this.dataline,
						},
						{
							type: "map",
							center: [124.135372, 42.702495], // 当前视角的中心点
							roam: false,
							label: {
								normal: {
									show: true,
									textStyle: {
										color: "#fff",
									},
									lineHeight: 20,
								},
								emphasis: {
									textStyle: {
										color: "#fff",
									},
								},
							},
							itemStyle: {
								normal: {
									borderColor: "#2ab8ff",
									borderWidth: 1.5,
									areaColor: "#12235c",
								},
								emphasis: {
									areaColor: "#2AB8FF",
									borderWidth: 0,
									color: "green",
								},
							},
							zoom: 1.2,
							map: "铁岭市", //使用
						},
					],
				});

				window.addEventListener("resize", () => {
					myChart.resize();
				});
			},


		},
	};
</script>

<style lang="less" scoped>

</style>
样式即可参照echarts的属性进行修改
2.图表使用
echarts提供的基本样式较为单调。推荐使用echarts社区的domo样式
各个图表使用方式大同小异
这里写一个我遇到的需求:让页面上的图表具有不停的动画,看起来一直有数据变化的效果
思路:使用echarts原生创建动画,修改动画显示时长,设置一个定时器,时间与动画时长相等,
当定时器结束清空并重新创建。
根据自己项目的逻辑修改定时器创建和销毁的位置
domo
<template>
	<div style="height:100%">
		<div id="main1" style="width:100%;height:100%"></div>
	</div>
</template>

<script>
	export default {
        data(){
            return {
                times:null, //定时器
            }
        },
        props:{
            clickMe: {
                type: String,
                default: "",
            },
        },

        //监听进入这个页面开始初始化元素
        watch: {
			clickMe:{
                handler(news , old) {
                    if(news == 'clickMe'){
                        this.init();
                    }else if(news == 'none'){
                        clearInterval(this.times)
                    }
                }
			},
		},

		methods: {
			init() {
				let myChart = this.$echarts.init(document.getElementById("main1"));


                let option = {
                    //出现动画所用时间
                    animationDuration:8000,
                    //鼠标悬浮提示
                    tooltip: {
                        trigger: 'axis',
                        axisPointer: {
                            type: 'shadow'
                        }
                    },
                    //显示位置 四周编剧
                    grid: {
                        top: "15%",
                        left: "7%",
                        right: "7%",
                        bottom: "14%",
                        containLabel: true,
                    },
                    //x轴设置项
                    xAxis: [{
                        type: 'category',
                        data: ['一月', '二月', '三月', '四月', '五月', '六月', '七月'],
                        axisLine: {
                            lineStyle: {
                                color: '#e2e9ff'
                            }
                        },
                        axisLabel: {
                            margin: 10,
                            color: '#e2e9ff',
                            textStyle: {
                                fontSize: 14
                            },
                        },
                        axisTick: {
                            show: false
                        }
                    }],
                    //y轴设置项
                    yAxis: [{
                        name: "单位(GB)",
                        axisLabel: {
                            formatter: '{value}',
                            color: '#e2e9ff',
                        },
                        axisTick: {
                            show: false
                        },
                        axisLine: {
                            show: false,
                            lineStyle: {
                                color: 'rgba(0,186,255,.6)'
                            }
                        },
                        splitLine: {
                            lineStyle: {
                                color: 'rgba(255,255,255,0.12)'
                            }
                        }
                    }],
                    series: [{
                        type: 'bar',
                        data: [2000, 4000, 8000, 12000, 7000, 4000, 3000],
                        barWidth: '14px',
                        itemStyle: {
                            normal: {
                                color: new this.$echarts.graphic.LinearGradient(0, 0, 0, 1, [{
                                    offset: 0,
                                    color: 'rgba(0,244,255,1)' // 0% 处的颜色
                                }, {
                                    offset: 1,
                                    color: 'rgba(0,77,167,1)' // 100% 处的颜色
                                }], false),
                                shadowColor: 'rgba(0,160,221,1)',
                                shadowBlur: 4,
                            }
                        },
                        //柱体顶部显示文字
                        label: {
                            normal: {
                                show: true,
                                lineHeight: 30,
                                formatter: '{c}',
                                position: 'top',
                                textStyle: {
                                    color: '#00D6F9',
                                    fontSize: 12
                                }

                            }
                        }
                    }]
                };

                this.times = setInterval(() => {
                    myChart.clear();
                    myChart.setOption(option);
                }, 5000);
                myChart.setOption(option);
                window.addEventListener("resize", () => {
                    myChart.resize();
                });
			},
		},
	};
</script>

<style lang="less" scoped>
</style>
更多推荐
 已为社区贡献1条内容


所有评论(0)