vue-Echarts柱状图箭头增长下降
vue2-Echarts柱状图箭头增长下降
·
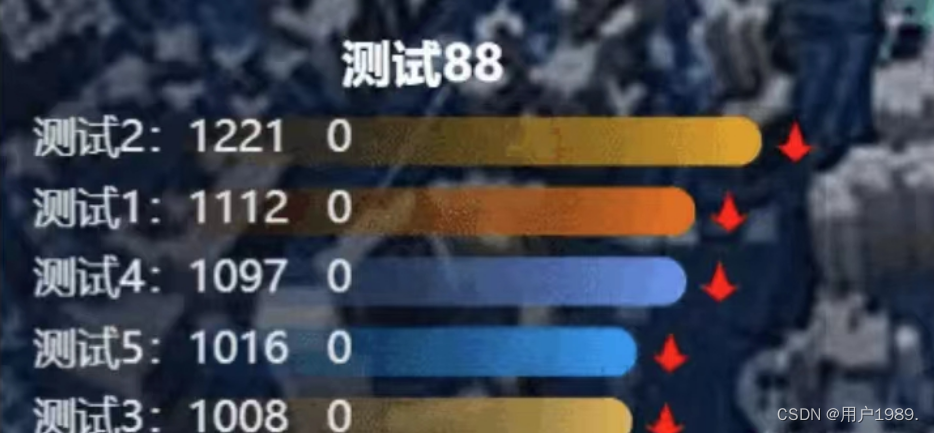
实现效果

简介--变量
newArr = [] // 存放柱图数据
oldArr = [] // 定义在return data 存放上一次柱图数据
Array = [] // 趋势上下数据 数据来源为新柱图数据 - 上一次柱图数据
count = '' // 用于计数 第一次加载页面为 oldArr 赋值
// 数据为模拟数据
实现过程
let _this = this
let newArr = [] // 存放柱图数据
let Array = [] // 趋势上下数据
// 模拟数据
for (let i = 0; i < 5; i++) {
  newArr.push(Math.round((Math.random() * 300) + 1000))
}
this.count++
// 第一次进入页面赋值 count计数 测试数据
if (this.count === 1) {
  this.oldArr = newArr
} else {
  setTimeout(() => {
    this.oldArr = newArr
  }, 2000)
}
for (let z = 0; z < newArr.length; z++) {
  Array[z] = newArr[z] - this.oldArr[z]
}
// 各个柱图颜色
let myColor = ['#f06f0c', '#f0a80c', '#e7b551', '#6495ED', '#009ffa', '#009ffa']
let up = 'path://M286.031,265l-16.025,3L300,223l29.994,45-16.041-3-13.961,69Z'
let down = 'path://M216.969,292l16.025-3L203,334l-29.994-45,16.041,3,13.961-69Z'
let option = {
  tooltip: {
    trigger: 'axis',
    axisPointer: {
      type: 'shadow'
    },
    formatter: function (params) {
      console.log(params)
      // params[0].name表示x轴数据
      return params[0].name + '<br/>' +
      "<span style='display:inline-block;width:10px;height:10px;margin-right:10px;border-radius:10px;background-color:" + params[0].color.colorStops[0].color + ";'></span>" +
      '测试1:' + params[0].value + '<br>' +
      "<span style='display:inline-block;width:10px;height:10px;margin-right:10px;border-radius:10px;background-color:" + params[1].color + ";'></span>" +
      '测试1:' + Array[params[0].dataIndex]
    },
    backgroundColor: 'rgba(0,90,222,0.8)', // 修改背景颜色
    textStyle: {
      color: '#ffffff' // 文字的颜色
    }
  },
  grid: {
    height: '100%',
    width: '92%',
    top: 0,
    left: 0
  },
  xAxis: {
    type: 'value',
    axisLine: { show: false },
    axisTick: { show: false },
    splitLine: { show: false },
    axisLabel: { show: false },
    max: 'dataMax'
  },
  yAxis: {
    axisLine: { show: false },
    axisLabel: { show: false },
    axisTick: { show: false },
    splitLine: { show: false },
    type: 'category',
    data: ['测试1', '测试2', '测试3', '测试4', '测试5'],
    inverse: true,
    animationDuration: 300,
    animationDurationUpdate: 300
  },
  series: [
    {
      realtimeSort: true,
      data: newArr,
      type: 'bar',
      barWidth: 18,
      label: {
        name: '123',
        show: true,
        // position: 'right',
        align: 'left',
        verticalAlign: 'middle',
        position: 'insideLeft',
        valueAnimation: true,
        // formatter: '{b}',
        fontSize: 16,
        color: '#eaeaea',
        formatter: function(params) {
          // console.log(params)
          return params.name + ':' + params.data + '   ' + Array[params.dataIndex]
        }
      },
      itemStyle: {
        borderRadius: [10, 10, 10, 10],
        color: function(params) {
          return new _this.$echarts.graphic.LinearGradient(1, 0, 0, 0, [            { offset: 0, color: myColor[params.dataIndex] },
            { offset: 1, color: 'transparent' }
          ])
        }
      }
    },
    {
      data: newArr,
      type: 'pictorialBar',
      symbol: function (data, params) {
        if (Array[params.dataIndex] > 0) {
          return up
        } else {
          return down
        }
      },
      symbolSize: [15, 15],
      symbolOffset: [20, 0],
      symbolPosition: 'end',
      itemStyle: {
        color: function (params) {
          if (Array[params.dataIndex] > 0) {
            return '#92fda5'
          } else {
            return '#ff0000'
          }
        }
      }
    }
  ]
}
关键代码
根据存储趋势上下数据Array判断显示箭头与颜色
symbol: function (data, params) {
    if (Array[params.dataIndex] > 0) {
      return up
    } else {
      return down
    }
 },

 color: function (params) {
          if (Array[params.dataIndex] > 0) {
            return '#92fda5'
          } else {
            return '#ff0000'
          }
}更多推荐
 已为社区贡献1条内容


所有评论(0)