

Recently, the company needed to make a flow chart. After looking at antv/X6, I felt it was very appropriate, so I studied it for half a month. There is no information on the Internet, and I'm afraid I'll forget. I'll record some events and methods I use, so that I can check them later.
1: The most important thing to implement the flow chart is the canvas. There are documents on the official website, which can easily implement the canvas. Let's take a look at the canvas code I wrote with VUE.
First, the most important thing is to download dependencies. If x6 is downloaded in vue, you need to download two dependencies;
npm install @antv/x6 --save
npm install @antv/x6-vue-shape
 Download these two dependencies and you can vue Used in X6 Yes


First, introduce dependencies in the page
import "@antv/x6-vue-shape";
import { Graph } from '@antv/x6';

Let's start writing code
stay methods Define a initX6 Method, and then get mounted Call in

initX6() {
      this.graph = new Graph({
        container: document.getElementById("containerChart"), //This is the ID name that the canvas needs to be mounted
        width: 1000,  //Canvas width
        height: 500, //Canvas height
        grid: this.grid, //The canvas style is defined in the modou layer and called with this
        autoResize: true, //Automatically change size with the window
      });
    },
If you need to define the canvas background grid, you can define it yourself. The following is a background grid I defined myself. You can call it directly with this. Name after the grid.
data(){
    return{
        grid: {
            // grid settings
            size: 20, // Grid size 10px
            visible: true, // Render mesh background
            type: "mesh",
            args: {
              color: "#D0D0D0",
              thickness: 1, // Grid line width / grid point size
              factor: 10,
            },
          },
        }
    }
At this time, define a width and height for your mount container in css, and you can see a canvas on the page. Adjust his position and start writing nodes.
Create a new JS file to define nodes and write drag and drop code.
import '@antv/x6-vue-shape';
import { Addon} from '@antv/x6';
// Drag to generate quadrilateral
export const startDragToGraph  = (graph,type,e) =>{
    const node =
    graph.createNode({
    width: 100,  //Width of node
    height: 60,   //Height of node
    attrs: {
      label: {
        text: type,
        fill: '#000000',
        fontSize: 14,
        textWrap: {
          width: -10 ,
          height: -10,
          ellipsis: true,
        },
      },
      body: {
        stroke: '#000000',
        strokeWidth: 1,
        fill: '#ffffff',
      }
    },
    ports: ports
  })
    const dnd = new Addon.Dnd({target:graph})
    dnd.start(node,e)
}
//The following is the code of the anchor point. Just know, I won't write them one by one.
const ports = {
    groups: {
      // Enter linked pile group definition
      top: {
        position: 'top',
        attrs: {
          circle: {
            r: 4,
            magnet: true,
            stroke: '#2D8CF0',
            strokeWidth: 2,
            fill: '#fff',
          },
        },
      },
      // Output link pile group definition
      bottom: {
        position: 'bottom',
        attrs: {
          circle: {
            r: 4,
            magnet: true,
            stroke: '#2D8CF0',
            strokeWidth: 2,
            fill: '#fff',
          },
        },
      },
      left: {
        position: 'left',
        attrs: {
          circle: {
            r: 4,
            magnet: true,
            stroke: '#2D8CF0',
            strokeWidth: 2,
            fill: '#fff',
          },
        },
      },
      right: {
        position: 'right',
        attrs: {
          circle: {
            r: 4,
            magnet: true,
            stroke: '#2D8CF0',
            strokeWidth: 2,
            fill: '#fff',
          },
        },
      },
    },
    items: [
      {
        id: 'port1',
        group: 'top',
      },
      {
        id: 'port2',
        group: 'bottom',
      },
      {
        id: 'port3',
        group: 'left',
      },
      {
        id: 'port4',
        group: 'right',
      }
    ],
}
After defining the nodes and anchors, return to the vue page and import the JS file
import { startDragToGraph } from "../methods.js"; //Import the defined JS file


go HTML Add manually dragged node content to the layer.
<template>
  <div class="warp">
    <div id="containerchart"></div>
    <div
      v-for="(item, index) in List"
      :key="index"
      class="btn"
      :title="item"
      @mousedown="startDrag(item, $event)"
    >
      <span>
        {{ item }}
      </span>
    </div>
  </div>
</template>

//The list of loops is written by yourself
data() {
    return {
      List: ["Built in node"],
      grid: {
        // grid settings
        size: 20, // Grid size 10px
        visible: true, // Render mesh background
        type: "mesh",
        args: {
          color: "#D0D0D0",
          thickness: 1, // Grid line width / grid point size
          factor: 10,
        },
      },
    };
  },

Then in methods Define the method in the type Spread js In the file.

 startDrag(type, e) {
      startDragToGraph(this.graph, type, e);
    },
After completing the above, you can get the following effects. Drag the node from the right to the canvas to display it.
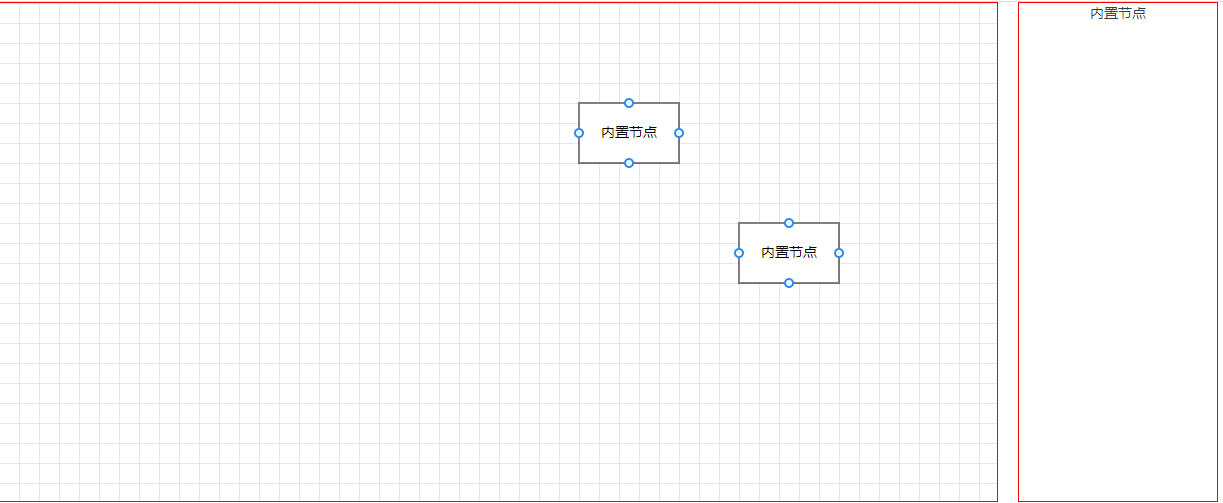
But now there are still problems with dragging and lines. Next, solve the connection problem.
 data() {
    return {
      List: ["Built in node"],


      grid: {
        // grid settings
        size: 20, // Grid size 10px
        visible: true, // Render mesh background
        type: "mesh",
        args: {
          color: "#D0D0D0",
          thickness: 1, // Grid line width / grid point size
          factor: 10,
        },
      },


      connectEdgeType: {
        //Connection mode
        connector: "normal",
        router: {
          name: "",
        },
      },

       //First, define the following three contents in data, which need to be used below
      graph: "",
      type: "grid",
      selectCell: "",
    };
  },

//Then add the following methods to the initX6 method in methods
         connecting: {
          // Node connection
          anchor: "center",
          connectionPoint: "anchor",
          allowBlank: false,
          snap: true,
        },
         createEdge() {
            return new Shape.Edge({
              attrs: {
                line: {
                  stroke: "#1890ff",
                  strokeWidth: 1,
                  targetMarker: {
                    name: "classic",
                    size: 8,
                  },
                  strokeDasharray: 0, //Dotted line
                  style: {
                    animation: "ant-line 30s infinite linear",
                  },
                },
              },
              label: {
                text: "",
              },
              connector: _that.connectEdgeType.connector,
              router: {
                name: _that.connectEdgeType.router.name || "",
              },
              zIndex: 0,
            });
          },

//Note that these two methods are written to the Graph instance of new.

//Then write a drag event to the node. This method is written to the initX6 method, outside the Graph instance of new.
   this.graph.on("selection:changed", (args) => {
        args.added.forEach((cell) => {
          this.selectCell = cell;
          if (cell.isEdge()) {
            cell.isEdge() && cell.attr("line/strokeDasharray", 5); //Dotted ant line
            cell.addTools([
              {
                name: "vertices",
                args: {
                  padding: 4,
                  attrs: {
                    strokeWidth: 0.1,
                    stroke: "#2d8cf0",
                    fill: "#ffffff",
                  },
                },
              },
            ]);
          }
        });
        args.removed.forEach((cell) => {
          cell.isEdge() && cell.attr("line/strokeDasharray", 0); //normal line
          cell.removeTools();
        });
      });
Now you can see that the anchor point on the built-in node on the canvas is always displayed. Let's deal with it.
//You need to add a method to the introduced X6 method first
import { Graph,FunctionExt } from "@antv/x6";

stay methods Define a traversal method in and call it when the mouse moves in and out..

   showPorts(ports, show) {
      for (let i = 0, len = ports.length; i < len; i = i + 1) {
        ports[i].style.visibility = show ? "visible" : "hidden";
      }
    },


Then give it in the method this.garph.on()Add two mouse in and out events. Move in to make the anchor visible and move out to make the anchor hidden. This will make the nodes of the canvas look better.

//Mouse in
this.graph.on(
        "node:mouseenter",
        FunctionExt.debounce(() => {
          const container = document.getElementById("containerchart");
          const ports = container.querySelectorAll(".x6-port-body");
          this.showPorts(ports, true);
        }),
        500
      );

//Mouse out
this.graph.on("node:mouseleave", () => {
        const container = document.getElementById("containerchart");
        const ports = container.querySelectorAll(".x6-port-body");
        this.showPorts(ports, false);
     });
Here's all the code
<template>
  <div class="container_warp">
    <div id="containerChart"></div>

    <div
      v-for="(item, index) in List"
      :key="index"
      class="btn"
      :title="item"
      @mousedown="startDrag(item, $event)"
    >
      <span>
        {{ item }}
      </span>
    </div>
  </div>
</template>
<script>
import "@antv/x6-vue-shape";
import { Graph, Shape, FunctionExt } from "@antv/x6";
import { startDragToGraph } from "../methods.js";
export default {
  data() {
    return {
      List: [
        "Directory listening",
        "data organization ",
        "Image Publishing",
        "object detection ",
        "change detection ",
        "Feature classification",
        "Expert pending trial",
        "Sample warehousing",
        "Image storage",
        "Target warehousing",
        "Sheet finishing",
        "Package download",
      ],

      graph: "",
      type: "grid",
      selectCell: "",

      connectEdgeType: {
        //Connection mode
        connector: "normal",
        router: {
          name: "",
        },
      },

      grid: {
        // grid settings
        size: 20, // Grid size 10px
        visible: true, // Render mesh background
        type: "mesh",
        args: {
          color: "#D0D0D0",
          thickness: 1, // Grid line width / grid point size
          factor: 10,
        },
      },
    };
  },

  methods: {
    initX6() {
      this.graph = new Graph({
        container: document.getElementById("containerChart"),
        width: 1000,
        height: 500,
        grid: this.grid,
        connecting: {
          // Node connection
          anchor: "center",
          connectionPoint: "anchor",
          allowBlank: false,
          snap: true,
        },
        createEdge() {
          return new Shape.Edge({
            attrs: {
              line: {
                stroke: "#1890ff",
                strokeWidth: 1,
                targetMarker: {
                  name: "classic",
                  size: 8,
                },
                strokeDasharray: 0, //Dotted line
                style: {
                  animation: "ant-line 30s infinite linear",
                },
              },
            },
            label: {
              text: "",
            },
            connector: _that.connectEdgeType.connector,
            router: {
              name: _that.connectEdgeType.router.name || "",
            },
            zIndex: 0,
          });
        },
      });
      // Move the mouse in and out of the node
      this.graph.on(
        "node:mouseenter",
        FunctionExt.debounce(() => {
          const container = document.getElementById("containerChart");
          const ports = container.querySelectorAll(".x6-port-body");
          this.showPorts(ports, true);
        }),
        500
      );
      this.graph.on("node:mouseleave", () => {
        const container = document.getElementById("containerChart");
        const ports = container.querySelectorAll(".x6-port-body");
        this.showPorts(ports, false);
      });

      this.graph.on("selection:changed", (args) => {
        args.added.forEach((cell) => {
          this.selectCell = cell;
          if (cell.isEdge()) {
            cell.isEdge() && cell.attr("line/strokeDasharray", 5); //Dotted ant line
            cell.addTools([
              {
                name: "vertices",
                args: {
                  padding: 4,
                  attrs: {
                    strokeWidth: 0.1,
                    stroke: "#2d8cf0",
                    fill: "#ffffff",
                  },
                },
              },
            ]);
          }
        });
        args.removed.forEach((cell) => {
          cell.isEdge() && cell.attr("line/strokeDasharray", 0); //normal line
          cell.removeTools();
        });
      });
    },

    showPorts(ports, show) {
      for (let i = 0, len = ports.length; i < len; i = i + 1) {
        ports[i].style.visibility = show ? "visible" : "hidden";
      }
    },
    // Drag to generate a square or circle
    startDrag(type, e) {
      console.log(type, e);
      console.log(this.graph);
      startDragToGraph(this.graph, type, e);
    },
  },
  mounted() {
    this.initX6();
  },
};
</script>
<style lang="less">
#containerChart {
  width: 1000px;
  height: 500px;
  border: 1px solid red;
  float: left;
}
.btn {
  width: 400px;
  float: right;
  margin-right: 500px;
}
</style>
This completes an X6 that manually generates nodes to the canvas What's left is some CSS problems. Here are a few X6 events. Convenient for later use or reference
this.garph.on('node:click',()=>{

    //This is the click node event

})

  this.graph.on("blank:click", () => {

       //This is the background event of clicking on the canvas

});

this.graph.on("cell:click", () => {

        //This is a click on the connector event

});

 // Delete node
deleteNode() {
   const cell = this.graph.getSelectedCells();
   this.graph.removeCells(cell);
   this.type = "grid";
 },
 //Empty canvas
deleteAll() {
   this.graph.clearCells();
 },
 //Destroy canvas
GraphDelete() {
   this.graph.dispose();
},


// Save png
saveToPNG() {
  //Save the picture below
 this.$nextTick(() => {
   this.graph.toPNG(
     (dataUri) => {
       console.log(dataUri);
       // download
       DataUri.downloadDataUri(dataUri, "Asset topology.png");
     },
     {
       backgroundColor: "white",
       padding: {
         top: 50,
         right: 50,
         bottom: 50,
         left: 50,
       },
       quality: 1,
       copyStyles: false,
     }
   );

   });
 },


this.graph.toJSON()Get all the contents of the node in the current canvas
JSON.stringify(this.graph.toJSON())You can convert all the node contents of the current canvas into JSON String save to local or background
JSON.parse(json); hold json The data is shaped into a data format and then passed fromJSON Method is then rendered onto the canvas.
this.graph.fromJSON(json); You can get it from the background or locally json The data is shaped and rendered on the canvas.
The following is some personal experience. Due to the limited information on the Internet, record it for easy reference in the future. Don't spray it if it's not well written. If you have any questions, you can also leave a message to me.


 已为社区贡献21233条内容

所有评论(0)