

【prometheus】Pushgateway安装和使用
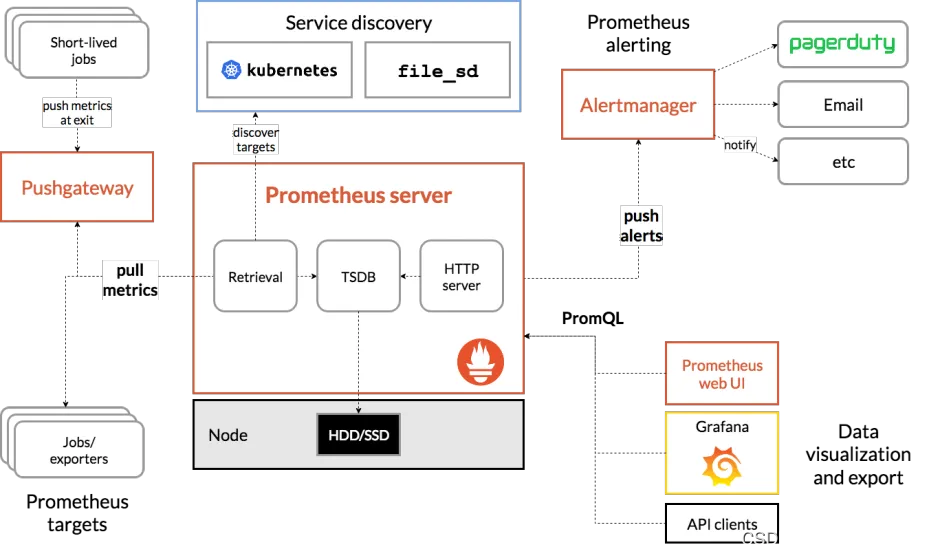
Pushgateway是prometheus的一个组件,prometheus server默认是通过exporter主动获取数据(默认采取pull拉取数据),pushgateway则是通过被动方式推送数据到prometheus server,用户可以写一些自定义的监控脚本把需要监控的数据发送给pushgateway, 然后pushgateway再把数据发送给Prometheus server。

目录
【Prometheus】概念和工作原理介绍_prometheus工作原理-CSDN博客
【Prometheus】k8s集群部署node-exporter_kubectl 安装 promethues node-exporter-CSDN博客
【prometheus】k8s集群部署prometheus server-CSDN博客
【prometheus】k8s集群部署Grafana安装和配置|Prometheus监控K8S
【prometheus】k8s集群部署AlertManager实现邮件和钉钉告警-CSDN博客
【prometheus】监控MySQL并实现可视化-CSDN博客
一、Pushgateway概述
1.1 Pushgateway简介
Pushgateway是prometheus的一个组件,prometheus server默认是通过exporter主动获取数据(默认采取pull拉取数据),pushgateway则是通过被动方式推送数据到prometheus server,用户可以写一些自定义的监控脚本把需要监控的数据发送给pushgateway, 然后pushgateway再把数据发送给Prometheus server。
1.2 Pushgateway优点
- Prometheus 默认采用定时pull 模式拉取targets数据,但是如果不在一个子网或者防火墙,prometheus就拉取不到targets数据,所以可以采用各个target往pushgateway上push数据,然后prometheus去pushgateway上定时pull数据
- 在监控业务数据的时候,需要将不同数据汇总, 汇总之后的数据可以由pushgateway统一收集,然后由 Prometheus 统一拉取。
1.3 pushgateway缺点
- Prometheus拉取状态只针对 pushgateway, 不能对每个节点都有效;
- Pushgateway出现问题,整个采集到的数据都会出现问题
- 监控下线,prometheus还会拉取到旧的监控数据,需要手动清理 pushgateway不要的数据。
二、测试环境
| IP | 主机名 |
| 192.168.2.139 | master1 |
| 192.168.40.140 | node1 |
三、安装测试
3.1 pushgateway安装
在node1节点操作
docker pull prom/pushgateway
docker run -d --name pushgateway -p 9091:9091 prom/pushgateway
在浏览器访问192.168.2.140:9091出现如下ui界面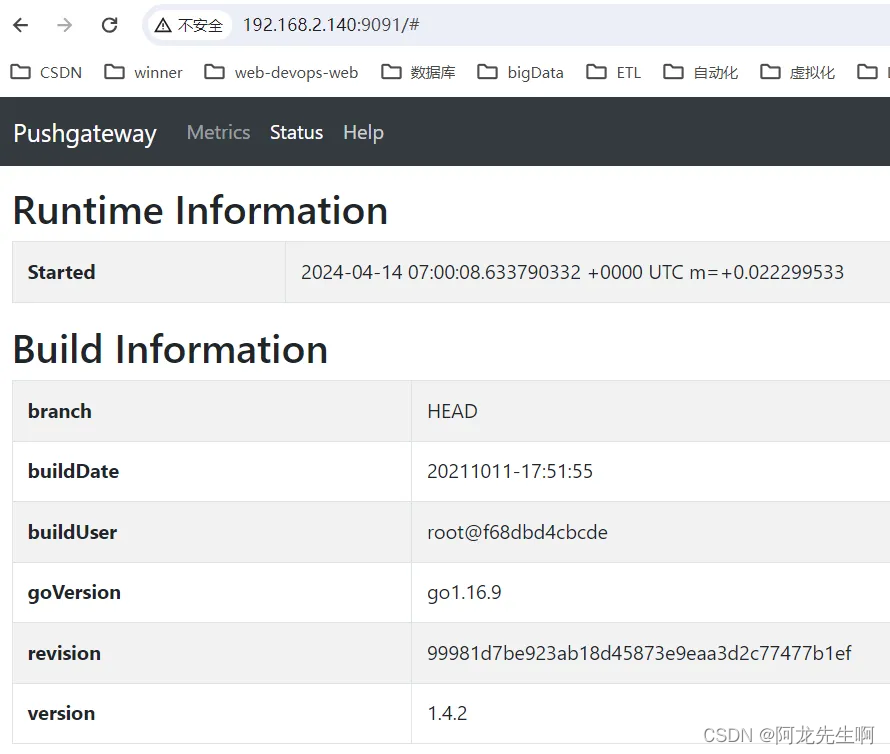
3.2 prometheus添加pushgateway
修改prometheus-cfg.yaml文件
- job_name: 'pushgateway'
      scrape_interval: 5s
      static_configs:
      - targets: ['192.168.2.140:9091']
   honor_labels: true
更新
kubectl apply -f prometheus-alertmanager-cfg.yaml
kubectl delete -f prometheus-alertmanager-deploy.yaml
kubectl apply  -f prometheus-alertmanager-deploy.yaml
登录prometheus http://192.168.2.139:30242/targets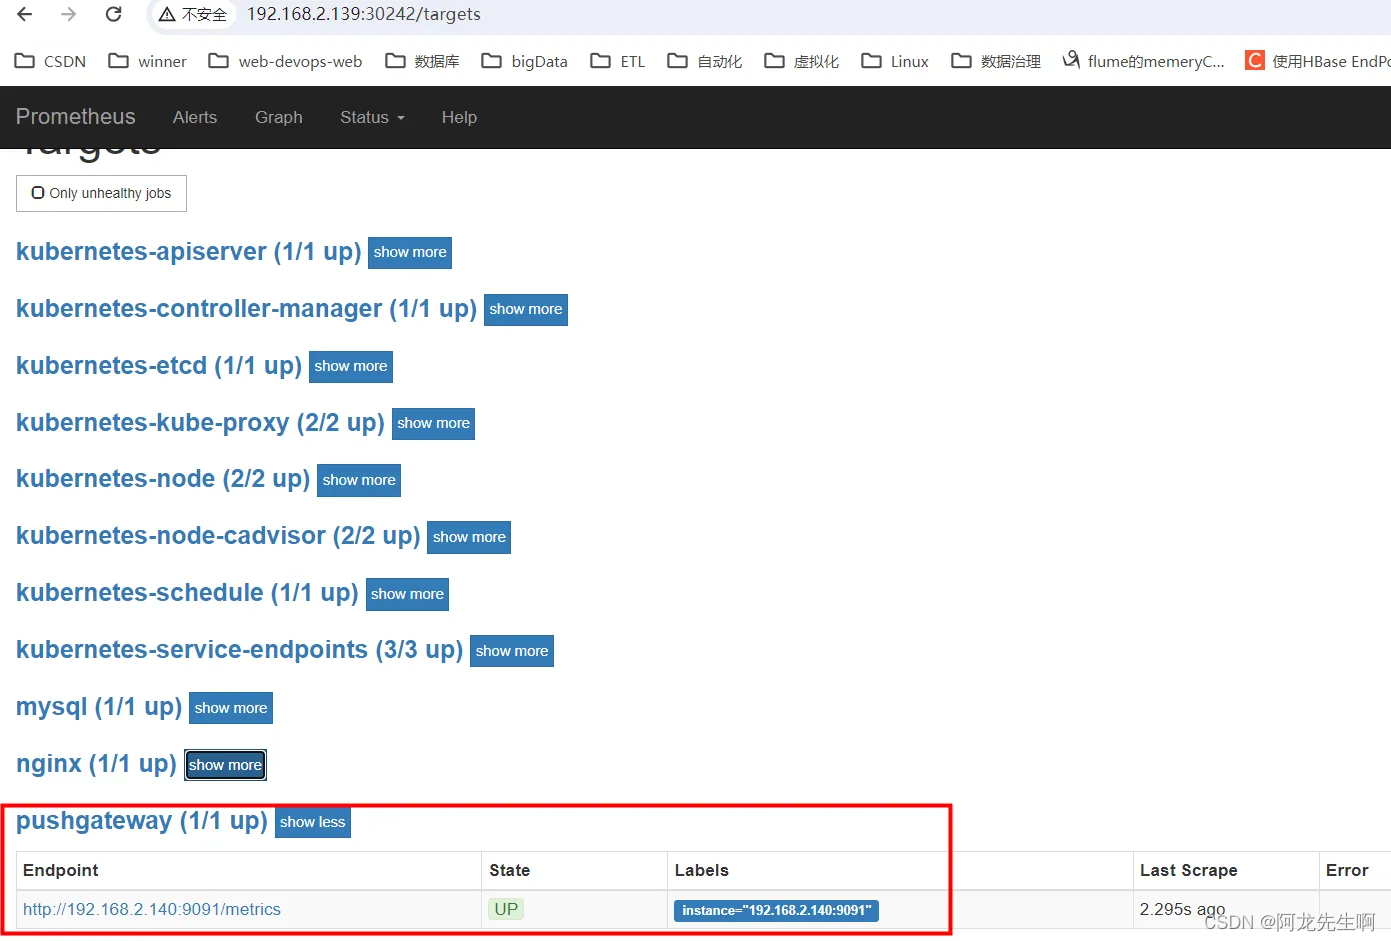
3.3 推送指定的数据格式到pushgateway
1.添加单条数据
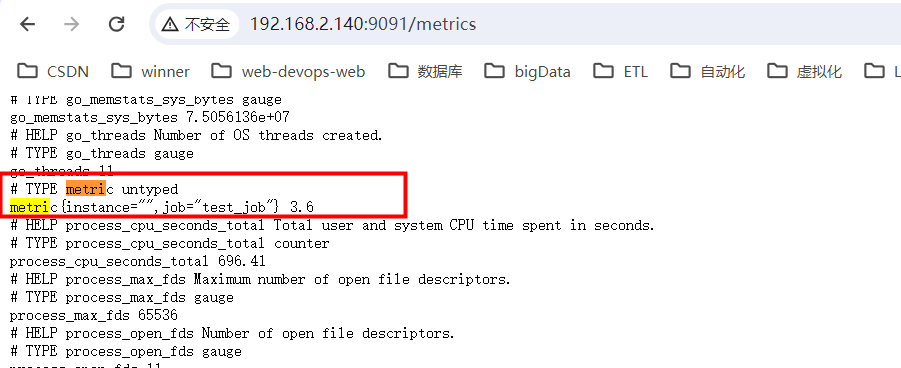
# 向 {job="test_job"} 添加单条数据:
echo " metric 3.6" | curl --data-binary @- http://192.168.2.140:9091/metrics/job/test_job
这里需要注意的是将<key & value>推送给pushgateway,curl --data-binary是将HTTP POST请求中的数据发送给HTTP服务器(pushgateway),和用户提交THML表单时浏览器的行为是一样的,HTTP POST请求中的数据为纯二进制数据。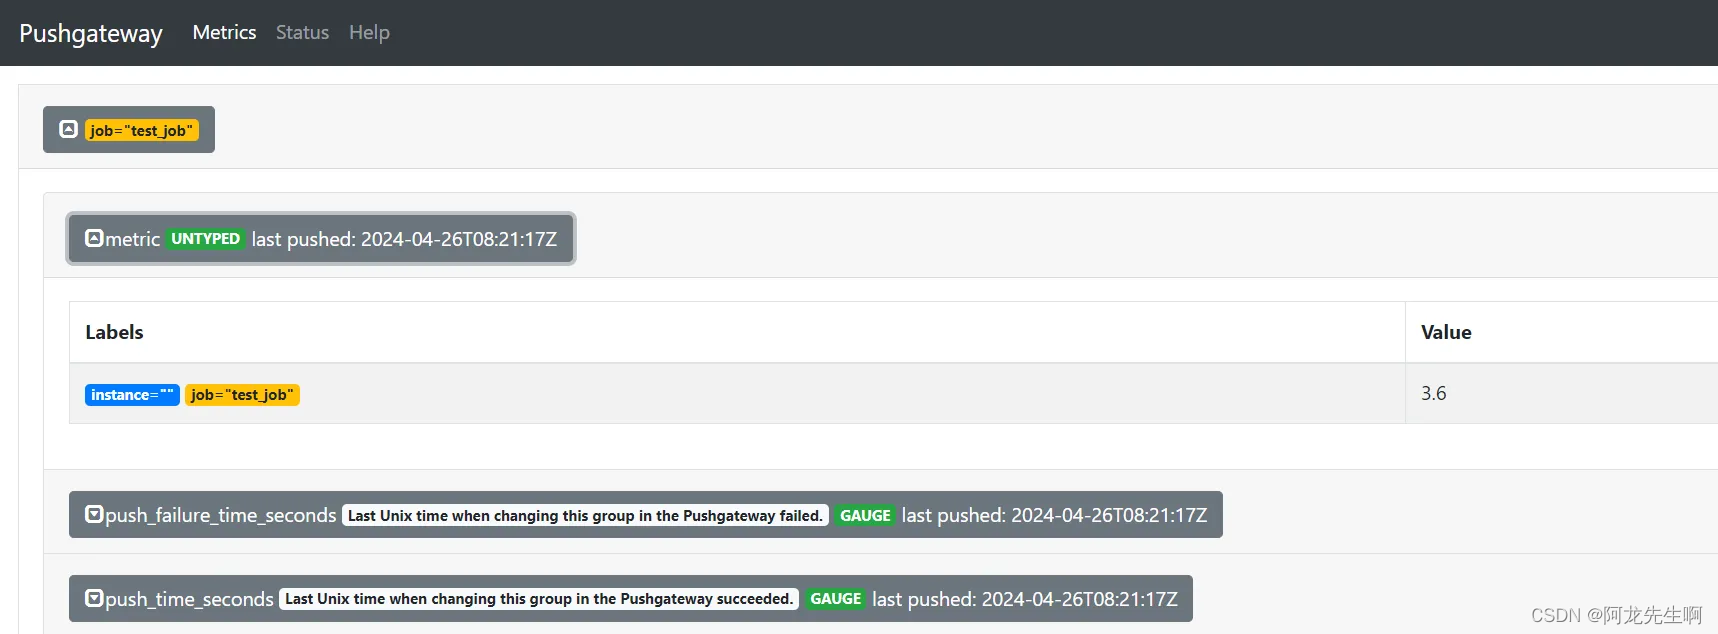
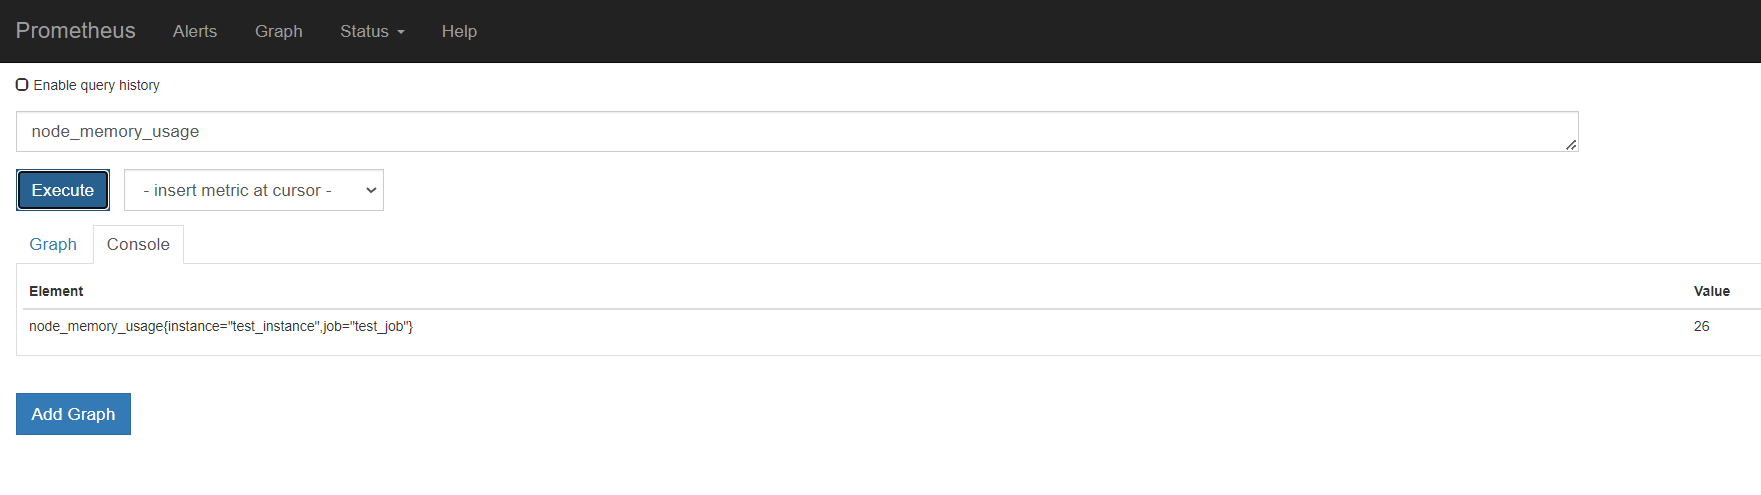
prometheus web中查询
2.添加复杂数据
# 添加复杂数据
cat <<EOF | curl --data-binary @- http://192.168.2.140:9091/metrics/job/test_job/instance/test_instance
# TYPE node_memory_usage gauge
node_memory_usage 26
# TYPE memory_total gauge
node_memory_total 26000
EOF- http://192.168.2.143:9091/metrics/job/test_job:这是URL的主location,发送到哪个URL
- job/test_job:表示是推送到哪个prometheus定义的job里面,上面我们定义的job_name为pushgateway
- instance/test_instance:表示推送后显示的主机名称是什么,从上面pushgateway图也可以看出
如下是删除某个实例
# 删除某个组下某个实例的所有数据
curl -X DELETE http://192.168.2.140:9091/metrics/job/test_job/instance/test_instance

# 删除某个组下的所有数据:
curl -X DELETE http://192.168.2.140:9091/metrics/job/test_job
3.SDk-prometheus-client使用
python安装 prometheus_client
使用 pip 工具可以非常方便地安装 prometheus_client: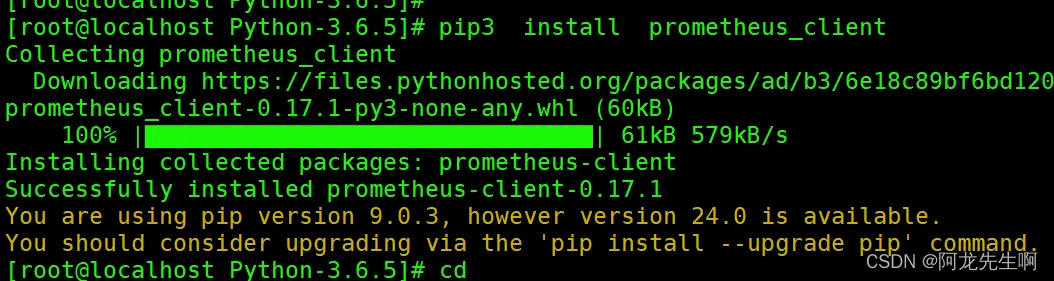
测试脚本
# -*- coding: utf-8 -*-

# 导入所需的库
from prometheus_client import CollectorRegistry, Gauge, push_to_gateway


if __name__ == '__main__':
    # 定义和注册指标
    registry = CollectorRegistry()
    labels = ['req_status', 'req_method', 'req_url']
    g_one = Gauge('requests_total', 'url请求次数', labels, registry=registry)
    g_two = Gauge('avg_response_time_seconds', '1分钟内的URL平均响应时间', labels, registry=registry)

    # 收集和记录指标数据
    g_one.labels('200','GET', '/test/url').set(1) #set设定值
    g_two.labels('200','GET', '/test/api/url/').set(10) #set设定值

    # 推送指标数据到Pushgateway
    push_to_gateway('http://192.168.2.140:9091', job='SampleURLMetrics', registry=registry)
在这个示例中,我们定义了一个名为requests_total的指标,记录了一个值为1和10的示例数据,并将指标数据推送到了名为example_job的job中。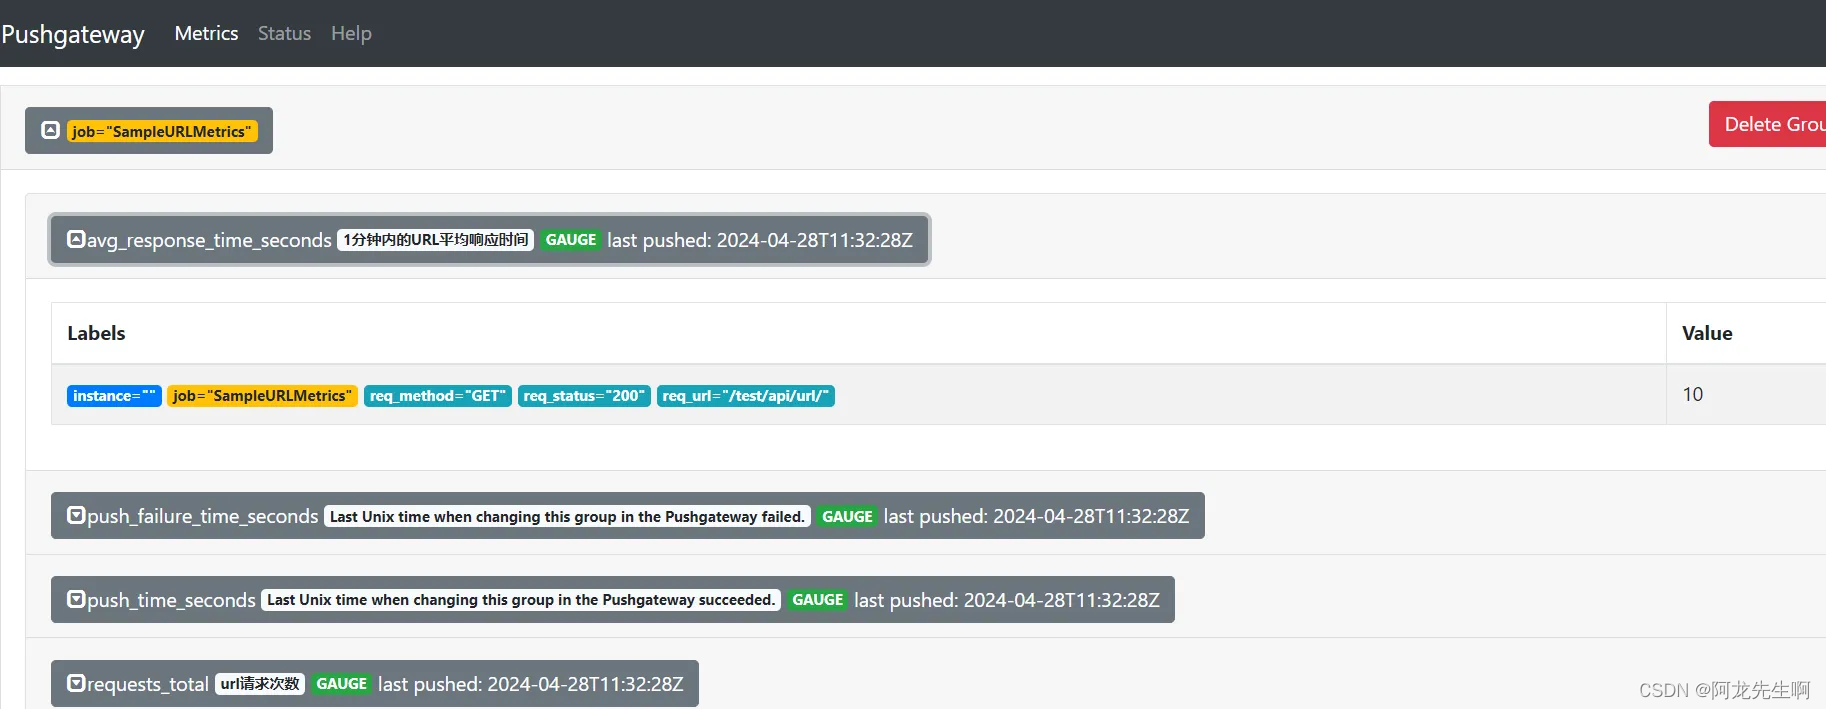

一起探索未来云端世界的核心,云原生技术专区带您领略创新、高效和可扩展的云计算解决方案,引领您在数字化时代的成功之路。
更多推荐


 124
124 0
0- 0


 已为社区贡献12条内容

所有评论(0)