K8S容器OOM killed排查
docker耗用完内存前,堆内存并没有达到上限,于是没有触发老年代GC,内存没有降下去。如果容器OOM killed,容器里的jvm进程没有Full GC,那么肯定是MaxRAMPercentage参数太高,导致堆内存没有用到上限,无法触发堆内存(老年代)GC。当实例内存超过95%时,对比top显示的的jvm进程内存和ps stats输出的docker实例内存信息,其余进程耗用的内存忽略不计。遂将
背景
数据服务平台南海容器k8s设置的内存上限2GB,多次容器被OOM killed。
启动命令
java -XX:MaxRAMPercentage=70.0 -XX:+HeapDumpOnOutOfMemoryError -XX:HeapDumpPath=/apps/logs/ ***.jar
排查过程
1 当收到实例内存超过95%告警时,把jvm进程堆dump下来后,用visual vm分析堆内存,并未发现内存泄漏。推测进程就需要花较多的内存,是内存分配不够。遂将内存增加到4GB。继续观察
2 南海和顺德docker实例依然OOM killed。 当实例内存超过95%时,dump出堆内存并分析,依然没有发现内存泄漏,比较正常。
3 怀疑是容器内部除了java的其他进程耗用了容器内存。当实例内存超过95%时,对比top显示的的jvm进程内存和ps stats输出的docker实例内存信息,其余进程耗用的内存忽略不计。
4 由于堆内存没有的到达上限,但是整个jvm进程内存超出了容器的内存限制。因此推测是对外内存(本地内存,栈内存等,元数据空间等)耗用较大,执行命令
/****/jcmd 1 VM.native_memory
VM.native_memory特性并未开启。
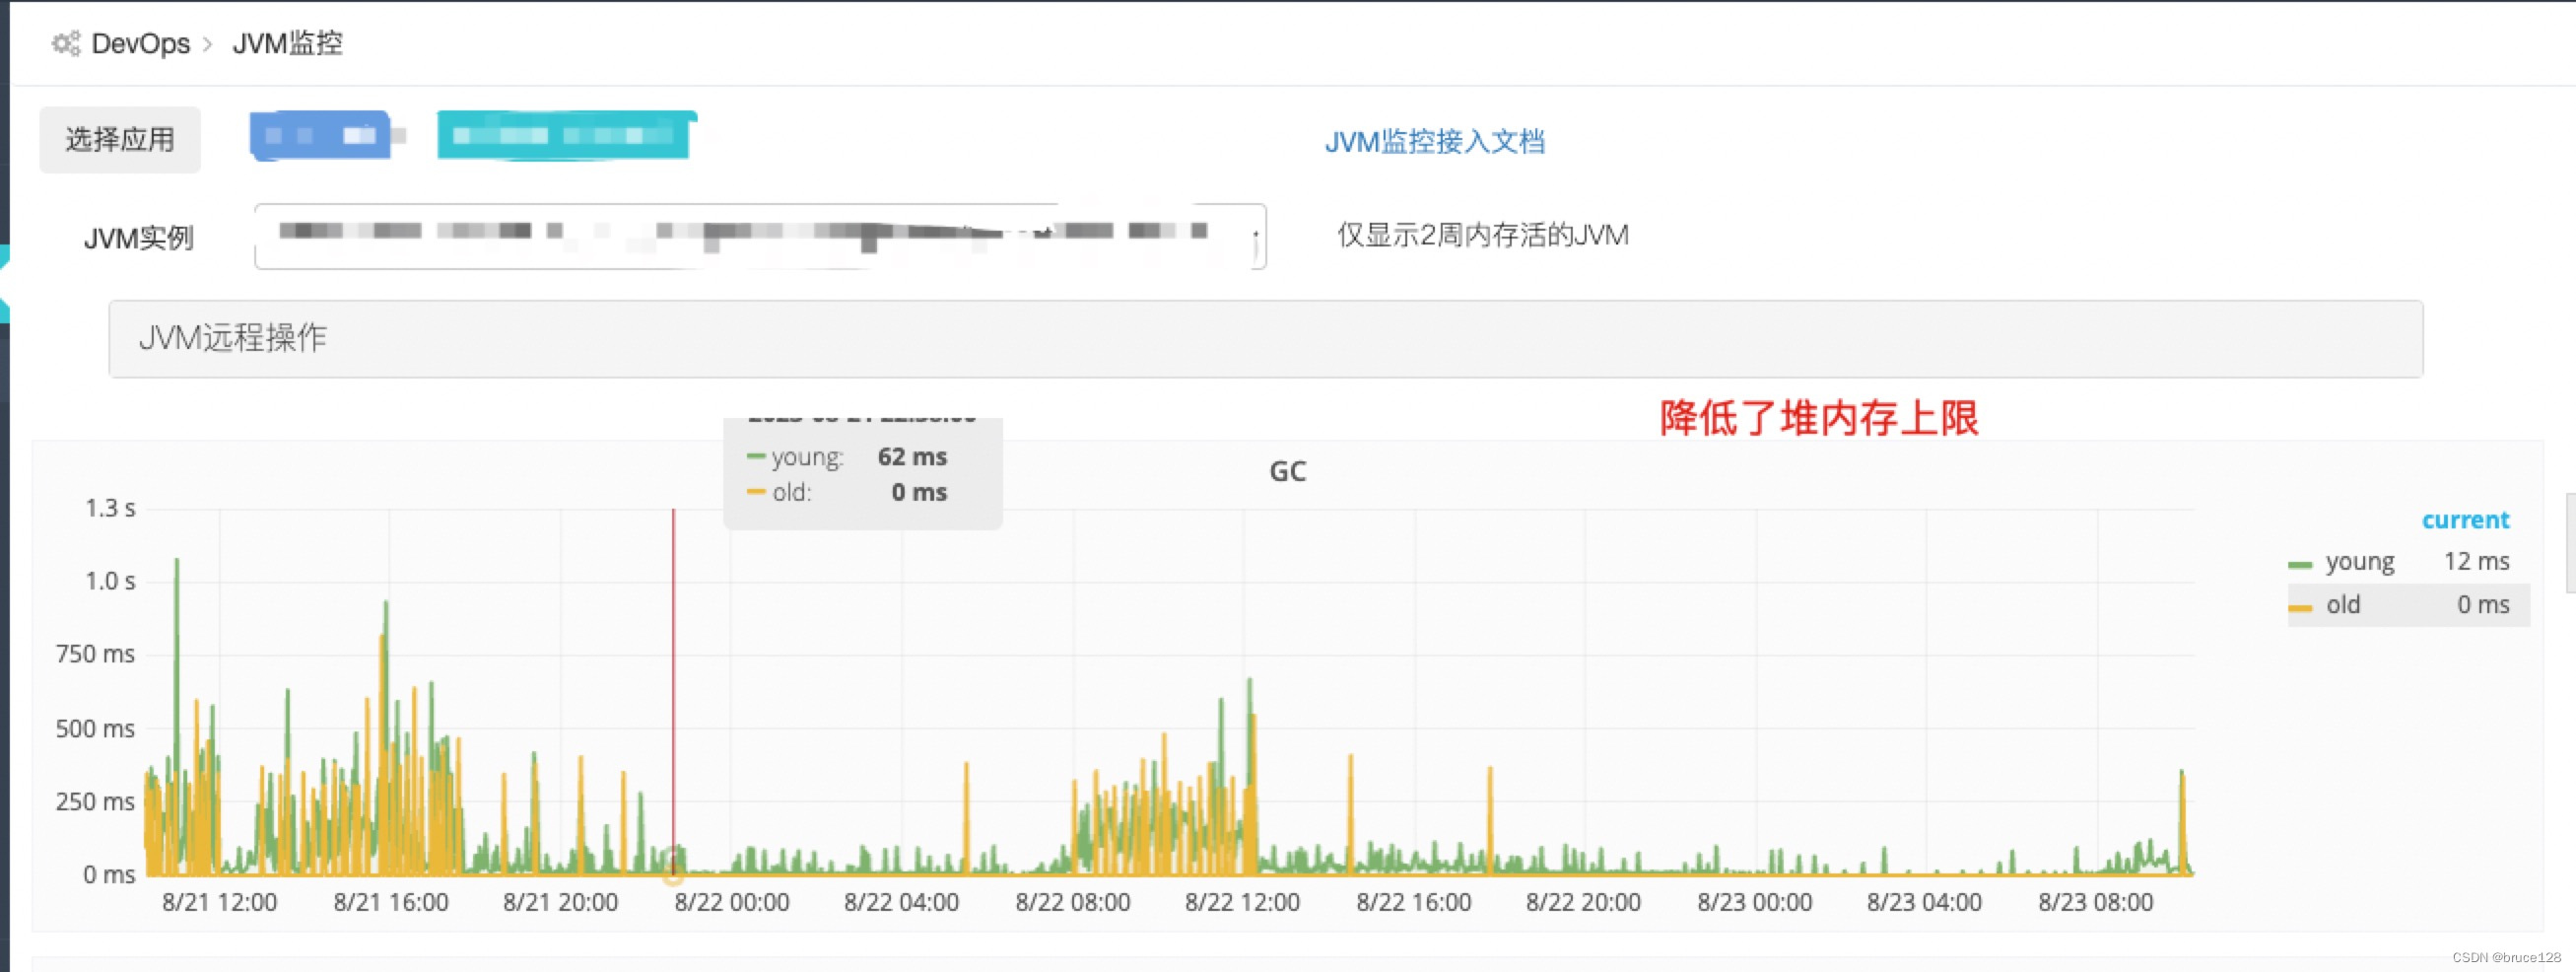
5 观察到一个现象,docker进程被oom killed之前,java应用堆内存并没有被Full gc。并且堆内存没有用到上限值2.8GB(4 * 0.7)。docker是go语言编写,并没有GC的能力。docker耗用完内存前,堆内存并没有达到上限,于是没有触发老年代GC,内存没有降下去。当堆内存不够的时候,依然会找docker容器申请内存。
6 修改jvm配置,将南海的MaxRAMPercentage降到60, 南海分组的堆内存上限变成2.4GB(4 * 0.6),顺德分组不变。并增加-XX:NativeMemoryTracking=summary配置。8.18日重启所有实例使新增的配置生效。观察一段时间


发现南海分组的full gc更加频繁,继续观察
7 后面团队其他实例OOM killed,登陆实例宿主机,查看/var/log/messages文件, 定位到发生时刻的日志,发现容器的内存耗用达到了实例的限制值
Apr  7 11:09:47 mvxl6778 kernel: VM Thread invoked oom-killer: gfp_mask=0x24000c0, order=0, oom_score_adj=-998
Apr  7 11:09:47 mvxl6778 kernel: VM Thread cpuset=c822c3d382c5db25d7f025cd46c18a9990cb1dc4e9ea5463cce595d74a4fa97b mems_allowed=0
Apr  7 11:09:47 mvxl6778 kernel: CPU: 0 PID: 67347 Comm: VM Thread Not tainted 4.4.234-1.el7.elrepo.x86_64 #1
Apr  7 11:09:47 mvxl6778 kernel: Hardware name: VMware, Inc. VMware Virtual Platform/440BX Desktop Reference Platform, BIOS 6.00 04/05/2016
Apr  7 11:09:47 mvxl6778 kernel: 0000000000000286 4e798947c7beb468 ffff88000a20bc80 ffffffff8134ee3a
Apr  7 11:09:47 mvxl6778 kernel: ffff88000a20bd58 ffff8800adb68000 ffff88000a20bce8 ffffffff8121192b
Apr  7 11:09:47 mvxl6778 kernel: ffffffff8119997c ffff8801621b2a00 0000000000000000 0000000000000206
Apr  7 11:09:47 mvxl6778 kernel: Call Trace:
Apr  7 11:09:47 mvxl6778 kernel: [<ffffffff8134ee3a>] dump_stack+0x6d/0x93
Apr  7 11:09:47 mvxl6778 kernel: [<ffffffff8121192b>] dump_header+0x57/0x1bb
Apr  7 11:09:47 mvxl6778 kernel: [<ffffffff8119997c>] ? find_lock_task_mm+0x3c/0x80
Apr  7 11:09:47 mvxl6778 kernel: [<ffffffff81211a9d>] oom_kill_process.cold+0xe/0x30e
Apr  7 11:09:47 mvxl6778 kernel: [<ffffffff812068e6>] ? mem_cgroup_iter+0x146/0x320
Apr  7 11:09:47 mvxl6778 kernel: [<ffffffff81208a18>] mem_cgroup_out_of_memory+0x2c8/0x310
Apr  7 11:09:47 mvxl6778 kernel: [<ffffffff81209653>] mem_cgroup_oom_synchronize+0x2e3/0x310
Apr  7 11:09:47 mvxl6778 kernel: [<ffffffff81204900>] ? get_mctgt_type+0x250/0x250
Apr  7 11:09:47 mvxl6778 kernel: [<ffffffff8119a31e>] pagefault_out_of_memory+0x3e/0xb0
Apr  7 11:09:47 mvxl6778 kernel: [<ffffffff81067882>] mm_fault_error+0x62/0x150
Apr  7 11:09:47 mvxl6778 kernel: [<ffffffff81068108>] __do_page_fault+0x3d8/0x3e0
Apr  7 11:09:47 mvxl6778 kernel: [<ffffffff81068142>] do_page_fault+0x32/0x70
Apr  7 11:09:47 mvxl6778 kernel: [<ffffffff81736b08>] page_fault+0x28/0x30
Apr  7 11:09:47 mvxl6778 kernel: Task in /kubepods/podb874ea27-0b15-4afc-8500-8a62bd73cf3c/c822c3d382c5db25d7f025cd46c18a9990cb1dc4e9ea5463cce595d74a4fa97b killed as a result of limit of /kubepods/podb874ea27-0b15-4afc-8500-8a62bd73cf3c
Apr  7 11:09:47 mvxl6778 kernel: memory: usage 2048000kB, limit 2048000kB, failcnt 141268
Apr  7 11:09:47 mvxl6778 kernel: memory+swap: usage 2048000kB, limit 9007199254740988kB, failcnt 0
Apr  7 11:09:47 mvxl6778 kernel: kmem: usage 14208kB, limit 9007199254740988kB, failcnt 0
Apr  7 11:09:47 mvxl6778 kernel: Memory cgroup stats for /kubepods/podb874ea27-0b15-4afc-8500-8a62bd73cf3c: cache:0KB rss:0KB rss_huge:0KB mapped_file:0KB dirty:0KB writeback:0KB swap:0KB inactive_anon:0KB active_anon:0KB inactive_file:0KB active_file:0KB unevictable:0KB
Apr  7 11:09:47 mvxl6778 kernel: Memory cgroup stats for /kubepods/podb874ea27-0b15-4afc-8500-8a62bd73cf3c/48bcfc65def8e5848caeeaf5f50ed6205b41c2da1b7ccddc7d1133ef7859373e: cache:0KB rss:2320KB rss_huge:2048KB mapped_file:0KB dirty:0KB writeback:0KB swap:0KB inactive_anon:0KB active_anon:2320KB inactive_file:0KB active_file:0KB unevictable:0KB
Apr  7 11:09:47 mvxl6778 kernel: Memory cgroup stats for /kubepods/podb874ea27-0b15-4afc-8500-8a62bd73cf3c/c822c3d382c5db25d7f025cd46c18a9990cb1dc4e9ea5463cce595d74a4fa97b: cache:0KB rss:2031472KB rss_huge:1589248KB mapped_file:0KB dirty:0KB writeback:0KB swap:0KB inactive_anon:0KB active_anon:2031444KB inactive_file:0KB active_file:0KB unevictable:0KB
Apr  7 11:09:47 mvxl6778 kernel: [ pid ]   uid  tgid total_vm      rss nr_ptes nr_pmds swapents oom_score_adj name
Apr  7 11:09:47 mvxl6778 kernel: [66952]     0 66952    66334      616       6       5        0          -998 pause
Apr  7 11:09:47 mvxl6778 kernel: [67231]  1000 67231  1906848   510149    1157      11        0          -998 java
Apr  7 11:09:47 mvxl6778 kernel: Memory cgroup out of memory: Kill process 67231 (java) score 0 or sacrifice child
Apr  7 11:09:48 mvxl6778 kernel: Killed process 67231 (java) total-vm:7627392kB, anon-rss:2023032kB, file-rss:17564kB
Apr  7 11:09:49 mvxl6778 kubelet: E0407 11:09:49.750842   42238 kubelet_volumes.go:154] orphaned pod "03b9c32c-e356-4547-8db8-35c91fee1666" found, but volume subpaths are still present on disk : There were a total of 5 errors similar to this. Turn up verbosity to see them.
8 执行dmesg命令
[27837536.622655] Task in /kubepods/podc3a7bd5b-6a9a-41f2-b42c-ef1889203801/053c6ef5780bce8c1be542c38470d065d1cfb3630b81bc739d8990a5289fec33 killed as a result of limit of /kubepods/podc3a7bd5b-6a9a-41f2-b42c-ef1889203801
[27837536.622664] memory: usage 3072000kB, limit 3072000kB, failcnt 49
[27837536.622665] memory+swap: usage 3072000kB, limit 9007199254740988kB, failcnt 0
[27837536.622667] kmem: usage 15968kB, limit 9007199254740988kB, failcnt 0
[27837536.622668] Memory cgroup stats for /kubepods/podc3a7bd5b-6a9a-41f2-b42c-ef1889203801: cache:0KB rss:0KB rss_huge:0KB mapped_file:0KB dirty:0KB writeback:0KB swap:0KB inactive_anon:0KB active_anon:0KB inactive_file:0KB active_file:0KB unevictable:0KB
[27837536.622730] Memory cgroup stats for /kubepods/podc3a7bd5b-6a9a-41f2-b42c-ef1889203801/3ecc1d2e0e14b13aafdeaf57432657154d9c23c6bba0d14b5458f7e226670bb6: cache:0KB rss:2284KB rss_huge:2048KB mapped_file:0KB dirty:0KB writeback:0KB swap:0KB inactive_anon:0KB active_anon:2284KB inactive_file:0KB active_file:0KB unevictable:0KB
[27837536.622784] Memory cgroup stats for /kubepods/podc3a7bd5b-6a9a-41f2-b42c-ef1889203801/053c6ef5780bce8c1be542c38470d065d1cfb3630b81bc739d8990a5289fec33: cache:36KB rss:3053712KB rss_huge:1443840KB mapped_file:0KB dirty:0KB writeback:0KB swap:0KB inactive_anon:0KB active_anon:3053712KB inactive_file:4KB active_file:4KB unevictable:0KB
[27837536.622831] [ pid ]   uid  tgid total_vm      rss nr_ptes nr_pmds swapents oom_score_adj name
[27837536.622971] [113432]     0 113347    66334      582       7       5        0          -998 pause
[27837536.622979] [113478]  1000 113478  2231341   761114    1655      12        0          -998 java
[27837536.622982] [114249]  1000 114249     3780      130      13       3        0          -998 sh
[27837536.622984] [114255]  1000 114255     3815      196      14       3        0          -998 bash
[27837536.622987] [114430]  1000 114430     3780      135      12       3        0          -998 sh
[27837536.622990] [114438]  1000 114438     3815      205      13       3        0          -998 bash
[27837536.622995] [78138]  1000 78138     3780      103      13       3        0          -998 sh
[27837536.622998] [78143]  1000 78143     3815      202      13       3        0          -998 bash
[27837536.623000] [27969]  1000 27969     3780      131      12       3        0          -998 sh
[27837536.623002] [27992]  1000 27992     3815      203      13       3        0          -998 bash
[27837536.623025] Memory cgroup out of memory: Kill process 113478 (java) score 0 or sacrifice child
[27837536.625233] Killed process 113478 (java) total-vm:8925364kB, anon-rss:3041072kB, file-rss:3384kB
[27838779.764721] VM Thread invoked oom-killer: gfp_mask=0x24000c0, order=0, oom_score_adj=-998
[27838779.764724] VM Thread cpuset=ad1ed05ee29bbaba6b3d8b464ce8cd3ee8aeb028fbd3ffd14566d8a25824fe47 mems_allowed=0
[27838779.764731] CPU: 5 PID: 108037 Comm: VM Thread Not tainted 4.4.234-1.el7.elrepo.x86_64 #1
[27838779.764732] Hardware name: VMware, Inc. VMware Virtual Platform/440BX Desktop Reference Platform, BIOS 6.00 04/05/2016
[27838779.764734]  0000000000000286 437aa04ae9c61e69 ffff880267fdfc80 ffffffff8134ee3a
[27838779.764736]  ffff880267fdfd58 ffff880136120000 ffff880267fdfce8 ffffffff8121192b
[27838779.764738]  ffffffff8119997c ffff8803b8012a00 0000000000000000 0000000000000206
[27838779.764740] Call Trace:
[27838779.764748]  [<ffffffff8134ee3a>] dump_stack+0x6d/0x93
[27838779.764752]  [<ffffffff8121192b>] dump_header+0x57/0x1bb
[27838779.764757]  [<ffffffff8119997c>] ? find_lock_task_mm+0x3c/0x80
[27838779.764759]  [<ffffffff81211a9d>] oom_kill_process.cold+0xe/0x30e
[27838779.764763]  [<ffffffff812068e6>] ? mem_cgroup_iter+0x146/0x320
[27838779.764765]  [<ffffffff81208a18>] mem_cgroup_out_of_memory+0x2c8/0x310
[27838779.764767]  [<ffffffff81209653>] mem_cgroup_oom_synchronize+0x2e3/0x310
[27838779.764769]  [<ffffffff81204900>] ? get_mctgt_type+0x250/0x250
[27838779.764771]  [<ffffffff8119a31e>] pagefault_out_of_memory+0x3e/0xb0
[27838779.764775]  [<ffffffff81067882>] mm_fault_error+0x62/0x150
[27838779.764776]  [<ffffffff81068108>] __do_page_fault+0x3d8/0x3e0
[27838779.764778]  [<ffffffff81068142>] do_page_fault+0x32/0x70
[27838779.764782]  [<ffffffff81736b08>] page_fault+0x28/0x30
[27838779.764783] Task in /kubepods/podc3a7bd5b-6a9a-41f2-b42c-ef1889203801/ad1ed05ee29bbaba6b3d8b464ce8cd3ee8aeb028fbd3ffd14566d8a25824fe47 killed as a result of limit of /kubepods/podc3a7bd5b-6a9a-41f2-b42c-ef1889203801
[27838779.764788] memory: usage 3072000kB, limit 3072000kB, failcnt 32457
[27838779.764789] memory+swap: usage 3072000kB, limit 9007199254740988kB, failcnt 0
[27838779.764790] kmem: usage 15332kB, limit 9007199254740988kB, failcnt 0
[27838779.764791] Memory cgroup stats for /kubepods/podc3a7bd5b-6a9a-41f2-b42c-ef1889203801: cache:0KB rss:0KB rss_huge:0KB mapped_file:0KB dirty:0KB writeback:0KB swap:0KB inactive_anon:0KB active_anon:0KB inactive_file:0KB active_file:0KB unevictable:0KB
[27838779.764839] Memory cgroup stats for /kubepods/podc3a7bd5b-6a9a-41f2-b42c-ef1889203801/053c6ef5780bce8c1be542c38470d065d1cfb3630b81bc739d8990a5289fec33: cache:4KB rss:0KB rss_huge:0KB mapped_file:0KB dirty:0KB writeback:0KB swap:0KB inactive_anon:0KB active_anon:0KB inactive_file:0KB active_file:4KB unevictable:0KB
[27838779.764866] Memory cgroup stats for /kubepods/podc3a7bd5b-6a9a-41f2-b42c-ef1889203801/6f518a65cbfb4f157a760f96b8562da00d1848918432cc622575a022070819f9: cache:0KB rss:292KB rss_huge:0KB mapped_file:0KB dirty:0KB writeback:0KB swap:0KB inactive_anon:0KB active_anon:292KB inactive_file:0KB active_file:0KB unevictable:0KB
[27838779.764902] Memory cgroup stats for /kubepods/podc3a7bd5b-6a9a-41f2-b42c-ef1889203801/ad1ed05ee29bbaba6b3d8b464ce8cd3ee8aeb028fbd3ffd14566d8a25824fe47: cache:4KB rss:3056368KB rss_huge:1458176KB mapped_file:0KB dirty:0KB writeback:0KB swap:0KB inactive_anon:0KB active_anon:3056368KB inactive_file:0KB active_file:4KB unevictable:0KB
[27838779.764933] [ pid ]   uid  tgid total_vm      rss nr_ptes nr_pmds swapents oom_score_adj name
[27838779.765060] [107843]     0 107843    66334      120       6       5        0          -998 pause
[27838779.765063] [107964]  1000 107964  2174971   765281    1667      12        0          -998 java
[27838779.765070] Memory cgroup out of memory: Kill process 107964 (java) score 0 or sacrifice child
[27838779.766467] Killed process 107964 (java) total-vm:8699884kB, anon-rss:3043596kB, file-rss:17528kB
结论
如果容器OOM killed,容器里的jvm进程没有Full GC,那么肯定是MaxRAMPercentage参数太高,导致堆内存没有用到上限,无法触发堆内存(老年代)GC。但此时java使用的内存超过了容器的限制的内存阈值,最终被容器kill.
除了堆区,元数据区和直接内存也可能导致jvm进程使用的内存找过容器的限制值。大家注意设置好。
jvm进程本身能否检测到cgroups技术的限制值?目前来看我在用的1.8版本是不行的。
解决办法
这个情况下就需要把MaxRAMPercentage参数适当调低出发对内存的gc回收,或者把实例的内存阈值调高些。

K8S/Kubernetes社区为您提供最前沿的新闻资讯和知识内容
更多推荐
 1
1 0
0- 0


 已为社区贡献1条内容

所有评论(0)