
openlayers入门教程
openlayers基础入门到实战平铺图层。对于提供预呈现、平铺的网格图像的层源,这些网格按特定分辨率的缩放级别组织。图像图层。服务器呈现的映像,可用于任意范围和分辨率。(3)ol.layer.Vector()很常用矢量图层。矢量平铺图层。图层用于客户端呈现矢量平铺数据。
openlayers基础入门到实战
一.openlayers基础篇
如果大家对openlayers不是很理解或者不熟悉,建议可以先读一下这两篇文章,写的很详细了,对入门有很好的帮助:
https://www.yuque.com/qstar-vrosu/fe/auhoye
https://blog.csdn.net/tk08888/article/details/127053451
在此我就做一些简短的描述:
openlayers主要还是以面向对象进行开发的,主要是配置项很多,与echarts有类似的味道。但是鉴于openlayers的文档写的很不友好,且为英文文档,这里就着重的讲几个比较重要的地图组成部分。
1.地图(Map),对应的类是ol.Map:
作用:创建地图的入口,如果需要创建一个地图,那么你就需要这个类。类似于ps软件,你需要p图,首先你需要一个ps软件。
2.视图(View),对应的类是ol.View
作用:控制地图显示的中心位置,范围,层级等
3.图层(Layer,需重点掌握)
作用:就是图层,如果说你初始化了一个地图,那么如果你想往这个地图上加东西,那么你可以通过添加图层的方式来加。(类似于ps中的图层叠加,最后添加的图层会覆盖之前添加的图层。)
a.如何添加图层到地图上?:
- 添加指定图层:map.addLayer(layer);
- 移除指定图层:map.removeLayer(layer);
b.如何定义图层?:
(1)ol.layer.Tile()
平铺图层。
对于提供预呈现、平铺的网格图像的层源,这些网格按特定分辨率的缩放级别组织。
(2)ol.layer.Image()
图像图层。
服务器呈现的映像,可用于任意范围和分辨率。
(3)ol.layer.Vector()很常用
矢量图层。
(4)ol.layer.VectorTile()
矢量平铺图层。
图层用于客户端呈现矢量平铺数据。
c.如何在图层上添加元素?(重要):
1)Feature(即地图上的几何对象)
定义矢量元素:new ol.Feature()
矢量元素样式:
设置样式:new ol.style.Style(),也可以使用feature.setStyle(style),未定义的话,可以使用它的盛放容器layer的样式;
获取样式:feature.getStyle()
2)Style(这个主要是为了上面的feature服务的,设置样式之类的)
矢量特征呈现样式的容器。
如何定义:newol.style.Style()
d.Layer和Feature是什么?以及他俩的区别
参考:https://www.giserdqy.com/secdev/openlayers/22042/
4.交互动作interaction
用的比较少,但是没有它的话,我们就没有办法直接用鼠标控制地图放大、缩小、移动,openlayers默认集成进去了,但是如果要开放某些能力,就需要用到这个,比如用户绘制点、线、面等
添加交互动作使用:map.addInteraction(interaction);
5.控件(Control)
比较少用到,主要是提供了一些比例尺,鹰眼,获取鼠标经纬度等一些功能。需要的话,直接添加进去就行了
6.叠加层Overlay(重要)
作用: overlay 简述 overlay是覆盖物的意思,顾名思义就是在地图上以另外一种形式浮现在地图上,这里很多同学会跟图层layers搞混淆,主要是放置一些和地图位置相关的元素,常见的地图覆盖物为这三种类型,如:popup 弹窗、label标注信息、text文本信息等,而这些覆盖物都是和html中的element等价的,通过overlay的属性element和html元素绑定同时设定坐标参数——达到将html元素放到地图上的位置,在平移缩放的时候html元素也会随着地图的移动而移动。
<div id="map">
  <div id="popup">

  </div>
  </div>
let popup = new ol.Overlay({
  element:document.getElementById('popup'),
  ...
});
popup.setPosition(coordinate);
map.addOverlay(popup);
7、投影Projections
需要给所有坐标和范围提供视图投影系(默认是EPAG:3857)。
主要用于转换投影系,使用ol.proj.transform()和ol.proj.transformExtendt进行转换
a.注意:关于地图坐标系问题:
ol默认使用的是3857坐标系(因为数据存储在EPSG:4326中,显示在EPSG:3857中),然后在设置中心点的时候,就需要把EPSG:4326地理坐标 转换为 EPSG:3857 墨卡托投影坐标
但是如果你使用的是百度地图,在百度地图上取了一个点,比如北京天安门的点:[116.403, 39.924]。你需要先把这个bd-09坐标系的点转换成wgs84坐标系的点,再拿这个转换后的点去转换成PSG:3857 墨卡托投影坐标
EPSG:4326 (WGS84)
前面说了 WGS84 是目前最流行的地理坐标系统。在国际上,每个坐标系统都会被分配一个 EPSG 代码,EPSG:4326 就是 WGS84 的代码。GPS 是基于 WGS84 的,所以通常我们得到的坐标数据都是 WGS84 的。一般我们在存储数据时,仍然按WGS84存储。
总结: EPSG:4326 = WGS84坐标系的点,但是显示的时候需要转换成墨卡托投影坐标。其他地图的需要先转成wgs84坐标系,再进行转换
二:openlayers实战篇
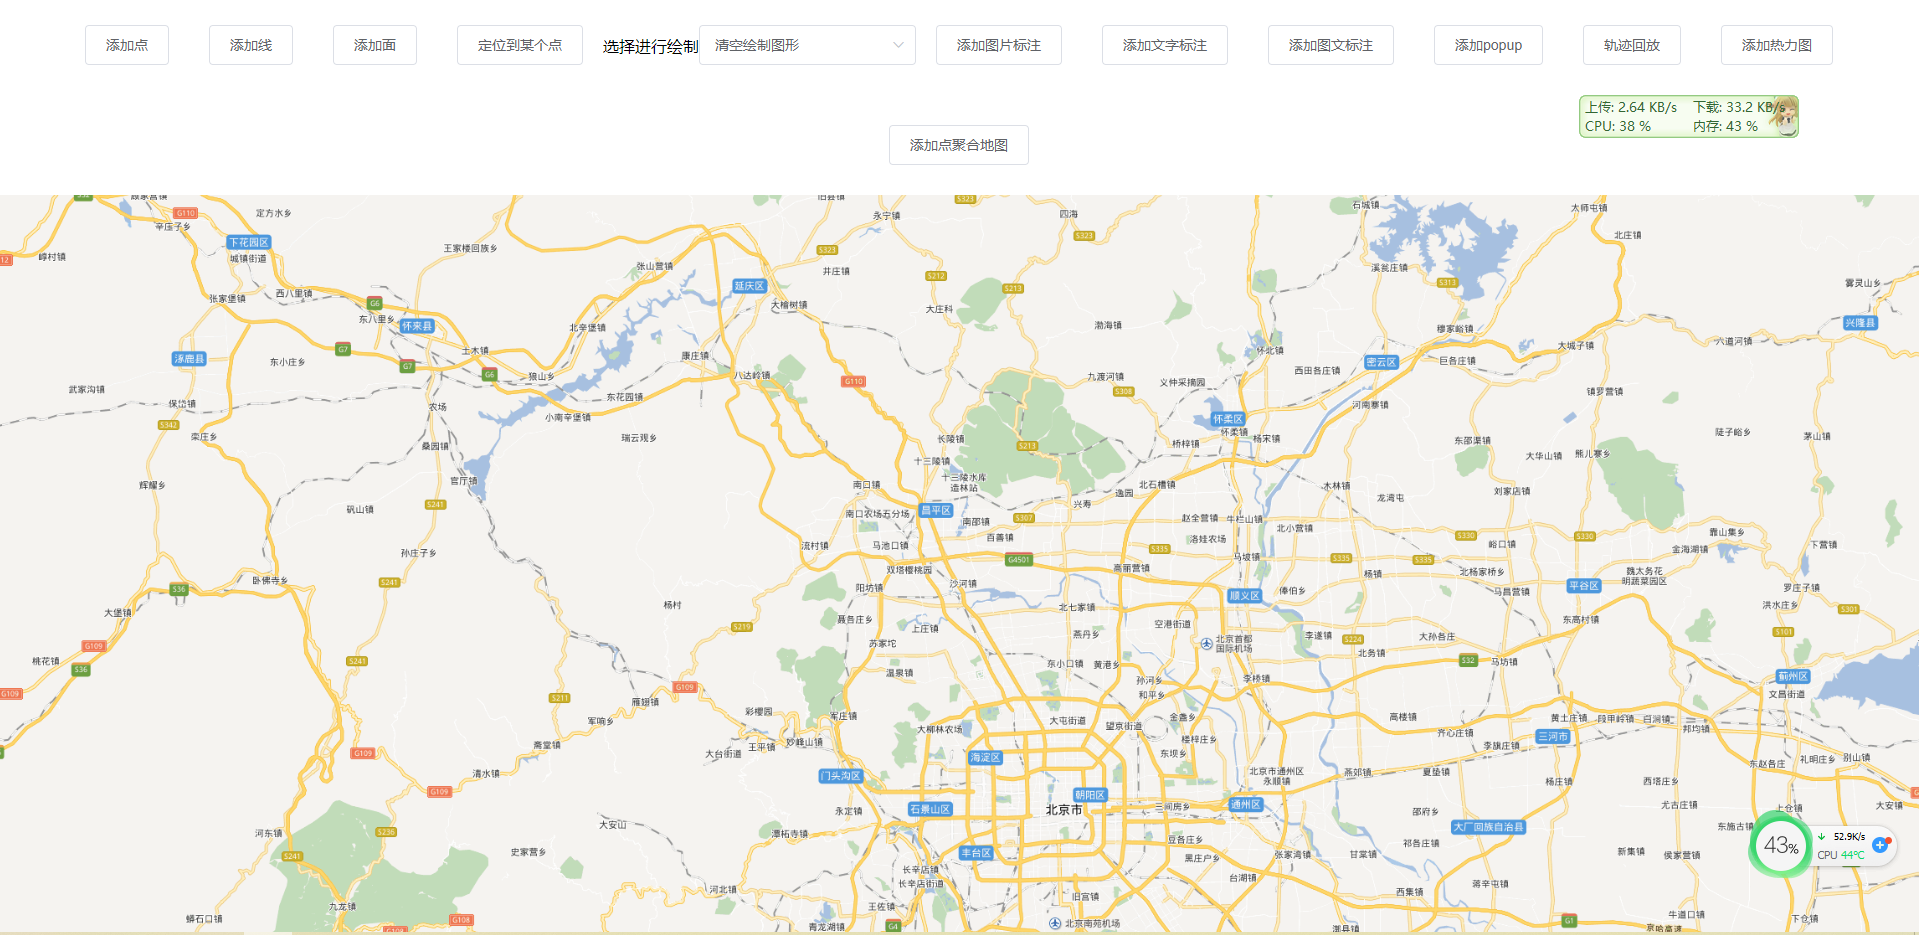
1.openlayers初始化百度地图:

mounted() {
  // 生成地图
  this.initMap()
},
  initMap() {
    var projection = ol.proj.get('EPSG:3857')
    //分辨率
    var resolutions = []
    for (var i = 0; i < 19; i++) {
      resolutions[i] = Math.pow(2, 18 - i)
    }
    var tilegrid = new ol.tilegrid.TileGrid({
      origin: [0, 0],
      resolutions: resolutions,
    })
    //拼接百度地图出图地址
    var baidu_source = new ol.source.TileImage({
      //设置坐标参考系
      projection: projection,
      //设置分辨率
      tileGrid: tilegrid,
      //出图基地址
      tileUrlFunction: function (tileCoord, pixelRatio, proj) {
        if (!tileCoord) {
          return ''
        }
        var z = tileCoord[0]
        var x = tileCoord[1]
        var y = tileCoord[2]

        if (x < 0) {
          x = 'M' + -x
        }
        if (y < 0) {
          y = 'M' + -y
        }
        return 'http://online3.map.bdimg.com/onlinelabel/?qt=tile&x=' + x + '&y=' + y + '&z=' + z + '&styles=pl&udt=20151021&scaler=1&p=1'
      },
    })
    //百度地图
    var baidu_layer = new ol.layer.Tile({
      source: baidu_source,
    })
    //地图容器
    this.map = new ol.Map({
      target: 'map',
      layers: [baidu_layer],
      view: new ol.View({
        center: ol.proj.transform([116.403, 39.924], 'EPSG:4326', 'EPSG:3857'),
        zoom: 12,
        minZoom: 3,
      }),
    })
  }
这里只写了初始化百度地图的过程,其他地图的大差不差,可以参考:
https://blog.csdn.net/liu2004051957/article/details/127929790?spm=1001.2014.3001.5506
离线地图参考往期文章:
https://blog.csdn.net/weixin_43239880/article/details/129247279?spm=1001.2014.3001.5502
2.openlayers添加点:

addPoint() {
      //创建一个点
      var point = new ol.Feature({
        geometry: new ol.geom.Point(ol.proj.transform([116.403, 39.924], 'EPSG:4326', 'EPSG:3857')),
      })
      //设置点1的样式信息
      point.setStyle(
        new ol.style.Style({
          //填充色
          fill: new ol.style.Fill({
            color: 'rgba(255, 255, 255, 0.2)',
          }),
          //边线颜色
          stroke: new ol.style.Stroke({
            color: '#ffcc33',
            width: 2,
          }),
          //形状
          image: new ol.style.Circle({
            radius: 17,
            fill: new ol.style.Fill({
              color: '#ffcc33',
            }),
          }),
        })
      )

      //实例化一个矢量图层Vector作为绘制层
      var source = new ol.source.Vector({
        features: [point],
      })
      //创建一个图层
      var vector = new ol.layer.Vector({
        source: source,
      })
      //将绘制层添加到地图容器中
      this.map.addLayer(vector)
    },
3.openlayers添加线:

 addLine() {
      //创建一个线
      var Line = new ol.Feature({
        geometry: new ol.geom.LineString([ol.proj.transform([116.403, 39.924], 'EPSG:4326', 'EPSG:3857'), ol.proj.transform([116.503, 39.994], 'EPSG:4326', 'EPSG:3857')]),
      })

      //设置线的样式
      Line.setStyle(
        new ol.style.Style({
          //填充色
          fill: new ol.style.Fill({
            color: 'rgba(255, 255, 255, 0.2)',
          }),
          //边线颜色
          stroke: new ol.style.Stroke({
            color: '#ffcc33',
            width: 5,
          }),
          //形状
          image: new ol.style.Circle({
            radius: 7,
            fill: new ol.style.Fill({
              color: '#ffcc33',
            }),
          }),
        })
      )

      //实例化一个矢量图层Vector作为绘制层
      var source = new ol.source.Vector({
        features: [Line],
      })
      //创建一个图层
      var vector = new ol.layer.Vector({
        source: source,
      })
      //将绘制层添加到地图容器中
      this.map.addLayer(vector)
    },
4.openlayers添加面

addArea() {
      //根据范围获取多边形
      var Rectangle = new ol.Feature({
        geometry: new ol.geom.Polygon.fromExtent([16208725.0, 3035304.0, 9841418.0, 5068487.0]),
      })

      Rectangle.setStyle(
        new ol.style.Style({
          fill: new ol.style.Fill({
            color: 'rgba(33,33,33,0.5)',
          }),
          stroke: new ol.style.Stroke({
            color: '#ffcc33',
            width: 4,
          }),
          image: new ol.style.Circle({
            radius: 7,
            fill: new ol.style.Fill({
              color: '#ffcc33',
            }),
          }),
        })
      )

      //实例化一个矢量图层Vector作为绘制层
      var source = new ol.source.Vector({
        features: [Rectangle],
      })
      //创建一个图层
      var vector = new ol.layer.Vector({
        source: source,
      })
      //将绘制层添加到地图容器中
      this.map.addLayer(vector)
    },
5.openlayers定位到某个点

toPoint() {
      //这里给动画设置一个初始值
      this.map.getView().animate({
        //将地理坐标转为投影坐标
        center: ol.proj.transform([117.403, 42.924], 'EPSG:4326', 'EPSG:3857'),
        duration: 1000,
        zoom: 12,
      })
    },
6.openlayers添加图片标注

addPic() {
      var createLabelStyle = function (feature) {
        return new ol.style.Style({
          /**{olx.style.IconOptions}类型*/
          image: new ol.style.Icon({
            anchor: [0.5, 60],
            anchorOrigin: 'top-right',
            anchorXUnits: 'fraction',
            anchorYUnits: 'pixels',
            offsetOrigin: 'top-right',
            // offset:[0,10],
            //图标缩放比例
            // scale:0.5,
            //透明度
            opacity: 0.75,
            //图标的url
            src: require('@/assets/logo.png'),
          }),
        })
      }
      //实例化Vector要素,通过矢量图层添加到地图容器中
      var iconFeature = new ol.Feature({
        // geometry: new ol.geom.Point(ol.proj.transform([116.403, 39.924], 'EPSG:4326', 'EPSG:3857')),
        geometry: new ol.geom.Point(ol.proj.transform([116.403, 39.924], 'EPSG:4326', 'EPSG:3857')),
      })

      iconFeature.setStyle(createLabelStyle(iconFeature))
      //矢量标注的数据源
      var vectorSource = new ol.source.Vector({
        features: [iconFeature],
      })
      //矢量标注图层
      var vectorLayer = new ol.layer.Vector({
        source: vectorSource,
      })
      this.map.addLayer(vectorLayer)
    },
7.openlayers添加文字标注

 addText() {
      /**
       * 创建矢量标注样式函数,设置image为图标ol.style.Icon
       * @param {ol.Feature} feature 要素
       */
      var createLabelStyle = function (feature) {
        return new ol.style.Style({
          text: new ol.style.Text({
            //位置
            textAlign: 'center',
            //基准线
            textBaseline: 'middle',
            //文字样式
            font: 'normal 14px 微软雅黑',
            //文本内容
            text: feature.get('name'),
            //文本填充样式(即文字颜色)
            fill: new ol.style.Fill({ color: '#aa3300' }),
            stroke: new ol.style.Stroke({ color: '#ffcc33', width: 2 }),
          }),
        })
      }

      //实例化Vector要素,通过矢量图层添加到地图容器中
      var iconFeature = new ol.Feature({
        geometry: new ol.geom.Point(ol.proj.transform([116.403, 39.924], 'EPSG:4326', 'EPSG:3857')),
        //名称属性
        name: '北京市',
        //大概人口数(万)
        population: 2115,
      })
      iconFeature.setStyle(createLabelStyle(iconFeature))
      //矢量标注的数据源
      var vectorSource = new ol.source.Vector({
        features: [iconFeature],
      })
      //矢量标注图层
      var vectorLayer = new ol.layer.Vector({
        source: vectorSource,
      })
      this.map.addLayer(vectorLayer)
    },
8.openlayers添加图文标注

addPicAndText() {
      /**
       * 创建矢量标注样式函数,设置image为图标ol.style.Icon
       * @param {ol.Feature} feature 要素
       */
      var createLabelStyle = function (feature) {
        return new ol.style.Style({
          image: new ol.style.Icon(
            /** @type {olx.style.IconOptions} */
            ({
              anchor: [0.5, 60],
              anchorOrigin: 'top-right',
              anchorXUnits: 'fraction',
              anchorYUnits: 'pixels',
              offsetOrigin: 'top-right',
              // offset:[0,10],
              //图标缩放比例
              // scale:0.5,
              //透明度
              opacity: 0.75,
              //图标的url
              src: require('@/assets/logo.png'),
            })
          ),
          text: new ol.style.Text({
            //位置
            textAlign: 'center',
            //基准线
            textBaseline: 'middle',
            //文字样式
            font: 'normal 14px 微软雅黑',
            //文本内容
            text: feature.get('name'),
            //文本填充样式(即文字颜色)
            fill: new ol.style.Fill({ color: '#aa3300' }),
            stroke: new ol.style.Stroke({ color: '#ffcc33', width: 2 }),
          }),
        })
      }

      //实例化Vector要素,通过矢量图层添加到地图容器中
      var iconFeature = new ol.Feature({
        geometry: new ol.geom.Point(ol.proj.transform([116.403, 39.924], 'EPSG:4326', 'EPSG:3857')),
        //名称属性
        name: '北京市',
        //大概人口数(万)
        population: 2115,
      })
      iconFeature.setStyle(createLabelStyle(iconFeature))
      //矢量标注的数据源
      var vectorSource = new ol.source.Vector({
        features: [iconFeature],
      })
      //矢量标注图层
      var vectorLayer = new ol.layer.Vector({
        source: vectorSource,
      })
      this.map.addLayer(vectorLayer)
    },
9.openlayers添加popup

<div ref="popup_content" class="popup_content" v-show="popupContentShow">
      <div class="fater">
        <div class="son">这里是注解文字</div>
      </div>
    </div>
methods:{
  addPic() {
      var createLabelStyle = function (feature) {
        return new ol.style.Style({
          /**{olx.style.IconOptions}类型*/
          image: new ol.style.Icon({
            anchor: [0.5, 60],
            anchorOrigin: 'top-right',
            anchorXUnits: 'fraction',
            anchorYUnits: 'pixels',
            offsetOrigin: 'top-right',
            // offset:[0,10],
            //图标缩放比例
            // scale:0.5,
            //透明度
            opacity: 0.75,
            //图标的url
            src: require('@/assets/logo.png'),
          }),
        })
      }
      //实例化Vector要素,通过矢量图层添加到地图容器中
      var iconFeature = new ol.Feature({
        // geometry: new ol.geom.Point(ol.proj.transform([116.403, 39.924], 'EPSG:4326', 'EPSG:3857')),
        geometry: new ol.geom.Point(ol.proj.transform([116.403, 39.924], 'EPSG:4326', 'EPSG:3857')),
      })

      iconFeature.setStyle(createLabelStyle(iconFeature))
      //矢量标注的数据源
      var vectorSource = new ol.source.Vector({
        features: [iconFeature],
      })
      //矢量标注图层
      var vectorLayer = new ol.layer.Vector({
        source: vectorSource,
      })
      this.map.addLayer(vectorLayer)
    },
  addPopup() {
      this.addPic()
      /**
       * 为map添加鼠标移动事件监听,当指向标注时改变鼠标光标状态
       */
      this.map.on('pointermove', e => {
        var pixel = this.map.getEventPixel(e.originalEvent)
        var hit = this.map.hasFeatureAtPixel(pixel)
        this.map.getTargetElement().style.cursor = hit ? 'pointer' : ''
      })
      /**
       * 为map添加点击事件监听,渲染弹出popup
       */
      this.map.on('click', evt => {
        //判断当前单击处是否有要素,捕获到要素时弹出popup
        var feature = this.map.forEachFeatureAtPixel(evt.pixel, (feature, layer) => {
          return feature
        })
        if (feature) {
          let popup = new ol.Overlay(
            /** @type {olx.OverlayOptions} */
            ({
              //要转换成overlay的HTML元素
              element: this.$refs.popup_content,
              //当前窗口可见
              autoPan: true,
              //Popup放置的位置
              positioning: 'center-center',
              //是否应该停止事件传播到地图窗口
              stopEvent: false,
              autoPanAnimation: {
                //当Popup超出地图边界时,为了Popup全部可见,地图移动的速度
                duration: 250,
              },
            })
          )
          this.popupContentShow = true
          popup.setPosition(evt.coordinate)
          this.map.addOverlay(popup)
        }
      })
    },
}
11.openlayers轨迹回放

addPointAndView() {
      var Coordinates = new Array()
      Coordinates.push(
        ol.proj.transform([117.403, 42.924], 'EPSG:4326', 'EPSG:3857'),
        ol.proj.transform([117.403, 41.924], 'EPSG:4326', 'EPSG:3857'),
        ol.proj.transform([117.403, 40.924], 'EPSG:4326', 'EPSG:3857'),
        ol.proj.transform([117.403, 38.924], 'EPSG:4326', 'EPSG:3857'),
        ol.proj.transform([117.403, 37.924], 'EPSG:4326', 'EPSG:3857'),
        ol.proj.transform([117.403, 32.924], 'EPSG:4326', 'EPSG:3857'),
        ol.proj.transform([127.403, 42.924], 'EPSG:4326', 'EPSG:3857'),
        ol.proj.transform([127.403, 52.924], 'EPSG:4326', 'EPSG:3857'),
        ol.proj.transform([137.403, 49.924], 'EPSG:4326', 'EPSG:3857')
      )
      let passCoordinate = []
      //将离散点构建成一条折线
      var route = new ol.geom.LineString(Coordinates)
      // -----------主要是把其中的经过的点都拿出来-----------------------------
      let trackLineLen = route.getLength()
      let pointCount = trackLineLen / (this.map.getView().getResolution() * 15)
      for (let i = 1; i < pointCount; i++) {
        passCoordinate.push(route.getCoordinateAt(i / pointCount))
      }
      passCoordinate.unshift(Coordinates[0])
      passCoordinate.push(Coordinates[Coordinates.length - 1])
      //获取直线的坐标
      // var routeCoords = route.getCoordinates()
      var routeCoords = passCoordinate
      // -----------主要是把其中的经过的点都拿出来-----------------------------
      var routeLength = routeCoords.length

      var routeFeature = new ol.Feature({
        type: 'route',
        geometry: route,
      })
      var geoMarker = new ol.Feature({
        type: 'geoMarker',
        geometry: new ol.geom.Point(routeCoords[0]),
      })
      var startMarker = new ol.Feature({
        type: 'icon',
        geometry: new ol.geom.Point(routeCoords[0]),
      })
      var endMarker = new ol.Feature({
        type: 'icon',
        geometry: new ol.geom.Point(routeCoords[routeLength - 1]),
      })

      var styles = {
        route: new ol.style.Style({
          stroke: new ol.style.Stroke({
            width: 6,
            color: [237, 212, 0, 0.8],
          }),
        }),
        icon: new ol.style.Style({
          image: new ol.style.Icon({
            anchor: [0.5, 1],
            src: require('@/assets/icon_address@2x.png'),
          }),
        }),
        geoMarker: new ol.style.Style({
          image: new ol.style.Circle({
            radius: 7,
            // snapToPixel: false,
            fill: new ol.style.Fill({ color: 'black' }),
            stroke: new ol.style.Stroke({
              color: 'white',
              width: 2,
            }),
          }),
        }),
      }

      var animating = false
      var speed, now
      var vectorLayer = new ol.layer.Vector({
        source: new ol.source.Vector({
          features: [routeFeature, geoMarker, startMarker, endMarker],
        }),
        style: function (feature) {
          //如果动画是激活的就隐藏geoMarker
          if (animating && feature.get('type') === 'geoMarker') {
            return null
          }
          return styles[feature.get('type')]
        },
      })
      this.map.addLayer(vectorLayer)
      var moveFeature = event => {
        var vectorContext = event.vectorContext
        var frameState = event.frameState
        if (animating) {
          var elapsedTime = frameState.time - now
          //通过增加速度,来获得lineString坐标
          var index = Math.round((speed * elapsedTime) / 1000)

          if (index >= routeLength) {
            stopAnimation(true)
            return
          }

          var currentPoint = new ol.geom.Point(routeCoords[index])
          var feature = new ol.Feature(currentPoint)
          vectorContext.drawFeature(feature, styles.geoMarker)
        }
        //继续动画效果
        this.map.render()
      }
      const startAnimation = () => {
        if (animating) {
          stopAnimation(false)
        } else {
          animating = true
          now = new Date().getTime()
          speed = 400
          // startButton.textContent = '结束运动'
          //隐藏geoMarker
          geoMarker.setStyle(null)
          //设置显示范围
          this.map.getView().setCenter(ol.proj.transform([116.403, 39.924], 'EPSG:4326', 'EPSG:3857'))
          this.map.on('postcompose', moveFeature)
          this.map.render()
        }
      }
      const stopAnimation = ended => {
        animating = false
        // startButton.textContent = '开始运动'

        //如果动画取消就开始动画
        var coord = ended ? routeCoords[routeLength - 1] : routeCoords[0]
        /** @type {ol.geom.Point} */
        geoMarker.getGeometry().setCoordinates(coord)
        //移除监听
        this.map.un('postcompose', moveFeature)
      }
      setTimeout(() => {
        startAnimation()
      }, 2000)
    },
12.openlayers添加热力图

 addHeatmap() {
      this.moveToPosition([116.403, 39.924], 4)
      //创建一个Heatmap图层
      var vector = new ol.layer.Heatmap({
        source: new ol.source.Vector({
          features: new ol.format.GeoJSON().readFeatures(heatData, {
            dataProjection: 'EPSG:4326',
            featureProjection: 'EPSG:3857',
          }),
        }),
        //热点半径
        radius: parseInt(15, 10),
        //模糊尺寸
        blur: parseInt(25, 10),
      })
      this.map.addLayer(vector)
      // 将已添加的图层装起来
      this.layerList.push(vector)
    },
13.openlayers添加点聚合地图

 addManyPoints() {
      //此示例创建10000个要素
      var count = 1000
      var features = new Array(count)
      for (var i = 0; i < count; ++i) {
        // var coordinates = [2 * e * Math.random() - e, 2 * e * Math.random() - e]
        var coordinates = ol.proj.transform([Math.random() * 100 + 100, Math.random() * 10 + 35], 'EPSG:4326', 'EPSG:3857')
        console.log(coordinates)
        features[i] = new ol.Feature(new ol.geom.Point(coordinates))
      }
      //矢量要素数据源
      var source = new ol.source.Vector({
        features: features,
      })
      //聚合标注数据源
      var clusterSource = new ol.source.Cluster({
        distance: 40,
        source: source,
      })
      //加载聚合标注的矢量图层
      var styleCache = {}
      var clusters = new ol.layer.Vector({
        source: clusterSource,
        style: function (feature, resolution) {
          var size = feature.get('features').length
          var style = styleCache[size]
          if (!style) {
            style = [
              new ol.style.Style({
                image: new ol.style.Circle({
                  radius: 20,
                  stroke: new ol.style.Stroke({
                    color: '#fff',
                  }),
                  fill: new ol.style.Fill({
                    color: '#3399CC',
                  }),
                }),
                text: new ol.style.Text({
                  text: size.toString(),
                  fill: new ol.style.Fill({
                    color: '#fff',
                  }),
                }),
              }),
            ]
            styleCache[size] = style
          }
          return style
        },
      })
      this.map.addLayer(clusters)
      // 下面的代码是让鼠标变成小手,并且有点击事件
      this.map.on('pointermove', e => {
        var pixel = this.map.getEventPixel(e.originalEvent)
        var hit = this.map.hasFeatureAtPixel(pixel)
        this.map.getTargetElement().style.cursor = hit ? 'pointer' : ''
      })
      /**
       * 为map添加点击事件监听,渲染弹出popup
       */
      this.map.on('click', evt => {
        //判断当前单击处是否有要素,捕获到要素时弹出popup
        var feature = this.map.forEachFeatureAtPixel(evt.pixel, (feature, layer) => {
          return feature
        })
        if (feature) {
          let popup = new ol.Overlay(
            /** @type {olx.OverlayOptions} */
            ({
              //要转换成overlay的HTML元素
              element: this.$refs.popup_content,
              //当前窗口可见
              autoPan: true,
              //Popup放置的位置
              positioning: 'bottom-center',
              //是否应该停止事件传播到地图窗口
              stopEvent: false,
              autoPanAnimation: {
                //当Popup超出地图边界时,为了Popup全部可见,地图移动的速度
                duration: 250,
              },
            })
          )
          this.popupContentShow = true
          popup.setPosition(evt.coordinate)
          this.map.addOverlay(popup)
        }
      })
    },
14.openlayers之用户在地图上绘制各类图形

mounted() {
    // 生成地图
    this.initMap()
    // 生成一个绘制层,用于地图绘制
    this.initDraw()
  },
initDraw() {
  //实例化一个矢量图层Vector作为绘制层
  this.source = new ol.source.Vector({ wrapX: false })
  this.vector = new ol.layer.Vector({
    source: this.source,
    style: new ol.style.Style({
      fill: new ol.style.Fill({
        color: 'rgba(255, 255, 255, 0.2)',
      }),
      stroke: new ol.style.Stroke({
        color: '#ffcc33',
        width: 10,
      }),
      image: new ol.style.Circle({
        radius: 7,
        fill: new ol.style.Fill({
          color: '#ffcc33',
        }),
      }),
    }),
  })
  //将绘制层添加到地图容器中
  this.map.addLayer(this.vector)
},
  //根据绘制类型进行交互绘制图形处理
addInteraction() {
    let type
    //绘制对象
    if (this.selectValue !== 'None') {
      type = this.selectValue
      if (this.source == null) {
        this.source = new ol.source.Vector({ wrapX: false })
        //添加绘制层数据源
        this.vector.setSource(this.source)
      }
      var geometryFunction, maxPoints
      if (this.selectValue === 'Square') {
        type = 'Circle'
        //正方形图形(圆)
        geometryFunction = ol.interaction.Draw.createRegularPolygon(4)
      } else if (this.selectValue === 'Box') {
        type = 'LineString'
        maxPoints = 2
        geometryFunction = function (coordinates, geometry) {
          if (!geometry) {
            //多边形
            geometry = new ol.geom.Polygon(null)
          }
          var start = coordinates[0]
          var end = coordinates[1]
          geometry.setCoordinates([[start, [start[0], end[1]], end, [end[0], start[1]], start]])
          return geometry
        }
      }
      //实例化交互绘制类对象并添加到地图容器中
      this.draw = new ol.interaction.Draw({
        //绘制层数据源
        source: this.source,
        /** @type {ol.geom.GeometryType}几何图形类型 */
        type: type,
        //几何信息变更时调用函数
        geometryFunction: geometryFunction,
        //最大点数
        maxPoints: maxPoints,
      })
      this.map.addInteraction(this.draw)
    } else {
      // console.log(111)
      this.source = null
      //清空绘制图形
      this.vector.setSource(this.source)
    }
  },
selectChange() {
    //移除绘制图形
    this.map.removeInteraction(this.draw)
    //添加交互绘制功能控件
    this.addInteraction()
  },
实战参考网站:
http://develop.smaryun.com:81/API/JS/OL5InterfaceDemo/index.htm
demo地址:

旨在为数千万中国开发者提供一个无缝且高效的云端环境,以支持学习、使用和贡献开源项目。
更多推荐

 28
28 0
0- 0


 已为社区贡献6条内容

所有评论(0)