
vue中3D饼图实现方案
于是乎当起了C-V战士,搬过来以后,不对,是我开发完以后呢,按照自己想要的效果修修改改了一下,看着确实不错。其中他的引导线的方案是在3D的饼图上面盖一个等数据的2D饼图,然后再把2D饼图隐藏掉。结果是啥呢,结果就是测试不通过,会有展示问题,引导线没指到地方,数据量偏差稍大的时候,乱指、引导线标题重合。近期项目中大屏展示需要3D饼图(PS:别问为什么不使用2D的,问就是产品觉得3D的好看),所以度娘
近期项目中大屏展示需要3D饼图(PS:别问为什么不使用2D的,问就是产品觉得3D的好看),所以度娘找了一波。
直接找到了用echarts-gl做3D饼图的示例,Echarts 3D饼图开发_长剑浣花咻咻咻的博客-CSDN博客Echarts 3D饼图指示线开发 https://blog.csdn.net/sinat_28071063/article/details/125393621
看完我直接好家伙,大哥洋洋洒洒写了一堆,看起来就很厉害。于是乎当起了C-V战士,搬过来以后,不对,是我开发完以后呢,按照自己想要的效果修修改改了一下,看着确实不错。其中他的引导线的方案是在3D的饼图上面盖一个等数据的2D饼图,然后再把2D饼图隐藏掉。我直接惊为天人,不得不感叹前辈们的创造力。然后我就美滋滋的使用了此方案。
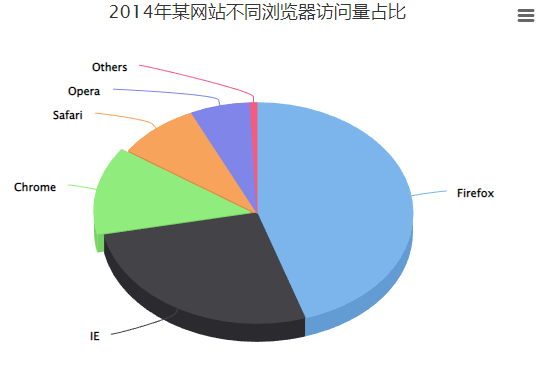
结果是啥呢,结果就是测试不通过,会有展示问题,引导线没指到地方,数据量偏差稍大的时候,乱指、引导线标题重合。就像这样:


没办法,只能更换方案了,就在我想着使用平面图形向内倾斜60度,重新计算投影占比大小的时候,我看到了另外一个插件 - Highcharts:3D 饼图 | HighchartsHighcharts中文官网,一站式Highcharts学习资源。提供Highcharts中文论坛、Highcharts在线示例、Highcharts中文APi、Highcharts 中文教程、Highcharts资源下载等
1、 使用方式和echarts差不多,通过API看实现也不难(不像antv,费劲)。
2、我看report报告,ecahrts-gl和Highcahrts资源占比也差不多。
直接上代码吧:
引入插件:npm install highcharts --save
1、定义容器(和ecahrts一样)
      <div class="chart-container">
        <div class="chart" :id="getId" ref="minchart" v-show="optionData.length > 0"></div>
        <div class="empty-text flex-rcc" v-show="optionData.length <= 0">暂无数据</div>
      </div>
2、资源引入
import Highcharts from "highcharts/highcharts";
import highcharts3d from 'highcharts/highcharts-3d';
highcharts3d(Highcharts);
3、初始化饼图
// 图表初始化
      initChart () {
        //取色盘
        const color = ['#D6D5C4', '#EFEFEF', '#4366F3', '#E76C68', '#89F7FE', '#0BA360'];
        let chart = Highcharts.chart(this.containerId, {
          chart: {
            type: 'pie',
            options3d: {
              enabled: true, // 否使用 3D 功能呈现图表
              alpha: 60, // 内旋转角度
              beta: 0 // 外旋转角度
            },
            backgroundColor: 'none',
            spacing: [20, 20, 30, 20] // 图表的内边距
          },
          credits: { enabled: false }, // 版权信息 false为不显示
          tooltip: {
            // 提示框数据点格式化字符串
            pointFormat: '{series.name}: <b>{point.percentage:.1f}%</b>'
          },
          plotOptions: {
            pie: {
              size: '100%',
              allowPointSelect: true,
              cursor: 'pointer',
              depth: 10, // 饼图厚度
              colors: color, // 取色盘,可以使用rgba方式
              dataLabels: {
                enabled: true, // 启用或禁用数据标签
                connectorPadding: 0, //从数据标签到连接器的距离。
                distance: 20, //数据标签与饼图边缘的距离。
                format: '<span style="color:#FFD753;font-size: 12px;">{point.y}</span>(万方)<br/>{point.name}',
                color: '#BAC3C4',
                style: {
                  "fontWeight": "normal",
                  "textOutline": "0"
                }
              }
            }
          },
          series: [{
            type: 'pie',
            name: '产量',
            data: this.optionData //数据集
          }]
        });
      },
效果展示:

总的来说,highcharts来做3D饼图的效果还是不错的,写法上比echarts-gl要简单多了,实现上比较丝滑。
但是,这玩意儿商用收费!!!
我的愿望是世界和平!

欢迎加入北京社区
更多推荐


 4
4 0
0- 0


 已为社区贡献1条内容

所有评论(0)