Sentinel+prometheus+grafana 实现k8s服务的流控
Sentinel+prometheus+grafana 实现k8s服务的流控
·
一、Sentinel整合actuator
-
引入依赖
<dependency>
            <groupId>org.springframework.boot</groupId>
            <artifactId>spring-boot-starter-actuator</artifactId>
        </dependency>
        <dependency>
            <groupId>com.alibaba.cloud</groupId>
            <artifactId>spring-cloud-starter-alibaba-nacos-discovery</artifactId>
        </dependency>
        <dependency>
            <groupId>com.alibaba.cloud</groupId>
            <artifactId>spring-cloud-starter-alibaba-sentinel</artifactId>
        </dependency>
        <dependency>
            <groupId>io.micrometer</groupId>
            <artifactId>micrometer-registry-prometheus</artifactId>
            <scope>runtime</scope>
        </dependency>
        <dependency>
            <groupId>com.alibaba.csp</groupId>
            <artifactId>sentinel-datasource-nacos</artifactId>
</dependency>-
配置yml nacos
spring:
  application:
    name: xxx-service
  cloud:
    nacos:
      discovery:
        server-addr: localhost:8848 #Nacos服务注册中心地址
    sentinel:
      transport:
        dashboard: localhost:8080 #配置 dashboard监控平台地址
        port: 8719 #默认8719端口 如果被占用就自增直至找到未被占用的端口
      datasource:
        ds1:
          nacos:
            server-addr: localhost:8848
            dataId: ${spring.application.name}
            groupId: DEFAULT_GROUP
            data-type: json
            rule-type: flow
management:
  endpoints:
    web:
      exposure:
        include: 'prometheus,health,info' //监听的端口
-
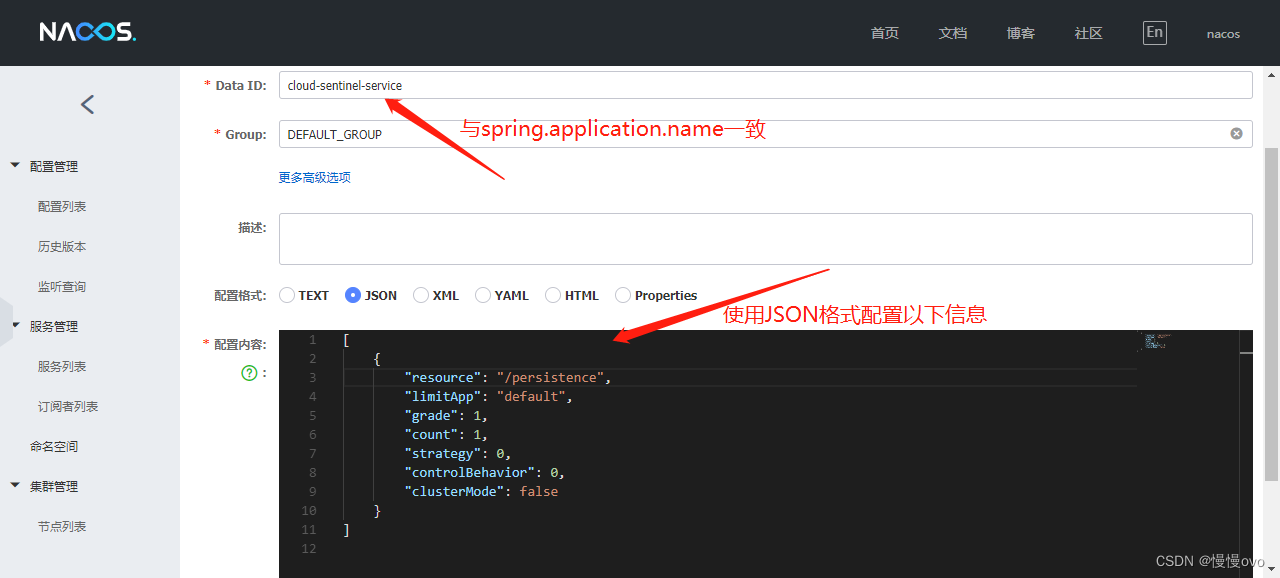
在nacos配置熔断限流规则
sentinel规则保存在内存里,重启数据丢失,用nacos持久化
二、Sentinel接入RocketMQ
-
引入 sentinel-core 依赖
<dependency>
    <groupId>com.alibaba.csp</groupId>
    <artifactId>sentinel-core</artifactId>
    <version>x.y.z</version>
</dependency>-
接受消息处理时埋点
PullResult pullResult = consumer.pullBlockIfNotFound(mq, null, getMessageQueueOffset(mq), 32);
  if (pullResult.getMsgFoundList() != null) {
     for (MessageExt msg : pullResult.getMsgFoundList()) {
          doSomething(msg);
             }
     }
private static void doSomething(MessageExt message) {
pool.submit(() -> {
Entry entry = null;
try {
entry = SphU.entry("资源名");
// Your business logic here.
} catch (BlockException ex) {
// Blocked.
System.out.println("Blocked: " + FAIL_COUNT.addAndGet(1));
} finally {
if (entry != null) {
entry.exit();
}
ContextUtil.exit();
}
});
}三、sentinel接入Prometheus的监控
-
sentinel 的 prometheus 扩展
sentinel 提供 了 MetricExtension 接口,通过 SPI 方式引入,PrometheusExtension ,通过 boot actuator prometheus 暴露:
https://github.com/alibaba/Sentinel/pull/735
https://blog.csdn.net/u013887008/article/details/125776847?ops_request_misc=&request_id=&biz_id=102&utm_term=sentinel%20Prometheus&utm_medium=distribute.pc_search_result.none-task-blog-2~all~sobaiduweb~default-0-125776847.142^v73^pc_new_rank,201^v4^add_ask,239^v2^insert_chatgpt&spm=1018.2226.3001.4187
-
prometheus.yml配置文件输入如下配置:
management.endpoint.metrics.enabled=true
management.endpoint.prometheus.enabled=true
management.metrics.export.prometheus.enabled=true
# pushgateway 地址
management.metrics.export.prometheus.pushgateway.base-url=192.168.xx.xx:9091
management.metrics.export.prometheus.pushgateway.push-rate=15s
management.metrics.export.prometheus.pushgateway.job=${spring.application.name}
management.metrics.export.prometheus.pushgateway.enabled=true
四、prometheus接入grafana
https://mp.weixin.qq.com/s?__biz=MzI0NTYzMjM0Ng==&mid=2247484477&idx=1&sn=5c4cd1448b9f94eb309610eda7d78e8a&scene=21#wechat_redirect
五、k8s接入prometheus
-
集群部署prometheus
-
pod自动发现prometheus
要想自动发现集群中的 pod,也需要我们在 pod 的annotation区域添加:prometheus.io/scrape=true的声明
-
service自动发现prometheus
要想自动发现集群中的 service,也需要我们在 service 的annotation区域添加:prometheus.io/scrape=true的声明

K8S/Kubernetes社区为您提供最前沿的新闻资讯和知识内容
更多推荐


 1
1 0
0- 0


 已为社区贡献1条内容

所有评论(0)