Linux perf 命令的使用(一)
Linux perf 基本命令的使用
前言
系统级性能优化通常包括两个阶段:性能剖析(performance profiling)和代码优化。
(1)性能剖析的目标是寻找性能瓶颈,查找引发性能问题的原因及热点代码。
(2)代码优化的目标是针对具体性能问题而优化代码或编译选项,以改善软件性能。
在性能剖析阶段,需要借助于现有的profiling工具,如perf等。
NAME
perf - Performance analysis tools for Linux
DESCRIPTION
Performance counters for Linux are a new kernel-based subsystem that provide a framework for all things performance analysis. It covers hardware level (CPU/PMU, Performance Monitoring
Unit) features and software features (software counters, tracepoints) as well.
一、perf简介
perf 子系统于 Linux内核 2.6.31 合入内核主线:
性能计数器子系统(Performance Counter subsystem)提供了对大多数现代CPU上可用的特殊性能计数器硬件寄存器的抽象。这些寄存器可以计算特定类型的硬件事件的数量,例如执行的指令数、缓存缺失次数或分支预测失败次数,而不会影响内核或应用程序的运行速度。这些寄存器还可以在事件数量达到阈值时触发中断,因此可以用于对在特定CPU上运行的代码进行性能分析。
用户通常不需要直接使用性能计数器的API。相反,Linux内核提供了一个强大的性能分析工具称为"perf",它位于tools/perf/目录下(这是将与内核相关的用户空间软件包含在内核树中的一种不寻常的决策)。
perf(perf_event,perf总是与event一起的)是官方的Linux性能分析工具,位于Linux内核源代码中的tools/perf下。它是一个具有分析、跟踪和脚本功能的多工具,是内核perf_events可观察性子系统的前端(front-end)。perf_events也称为Linux(Performance Counters for Linux:PCL)或Linux性能事件( Linux perf events:LPE)的性能计数器。perf_events和perf前端最初具有性能监视计数器(PMC)功能,但后来发展到支持基于事件的跟踪源:tracepoints, kprobes, uprobes, and USDT。如下所示:

图片来自于:https://www.brendangregg.com/perf.html
通过perf,应用程序可以利用PMU、tracepoint和内核中的计数器来进行性能统计。它不但可以分析制定应用 程序的性能问题(per thread),也可以用来分析内核的性能问题,当然也可以同时分析应用程序和内核,从而全面理解应用程序中的性能瓶颈。 使用perf,可以分析程序运行期间发生的硬件事件,比如instructions retired、processor clock cycles等; 也可以分析软件时间,比如page fault和进程切换。
与其他跟踪程序相比,perf 特别适用于CPU分析:分析(采样)CPU堆栈跟踪、跟踪CPU调度器行为,并检查PMC以了解微架构级别的CPU性能,包括循环行为。它的跟踪功能允许它分析其他目标,包括磁盘I/O和软件功能。
比如ftrace偏向于抓取数据,而perf对于抓取的数据进行了分析。如下图所示: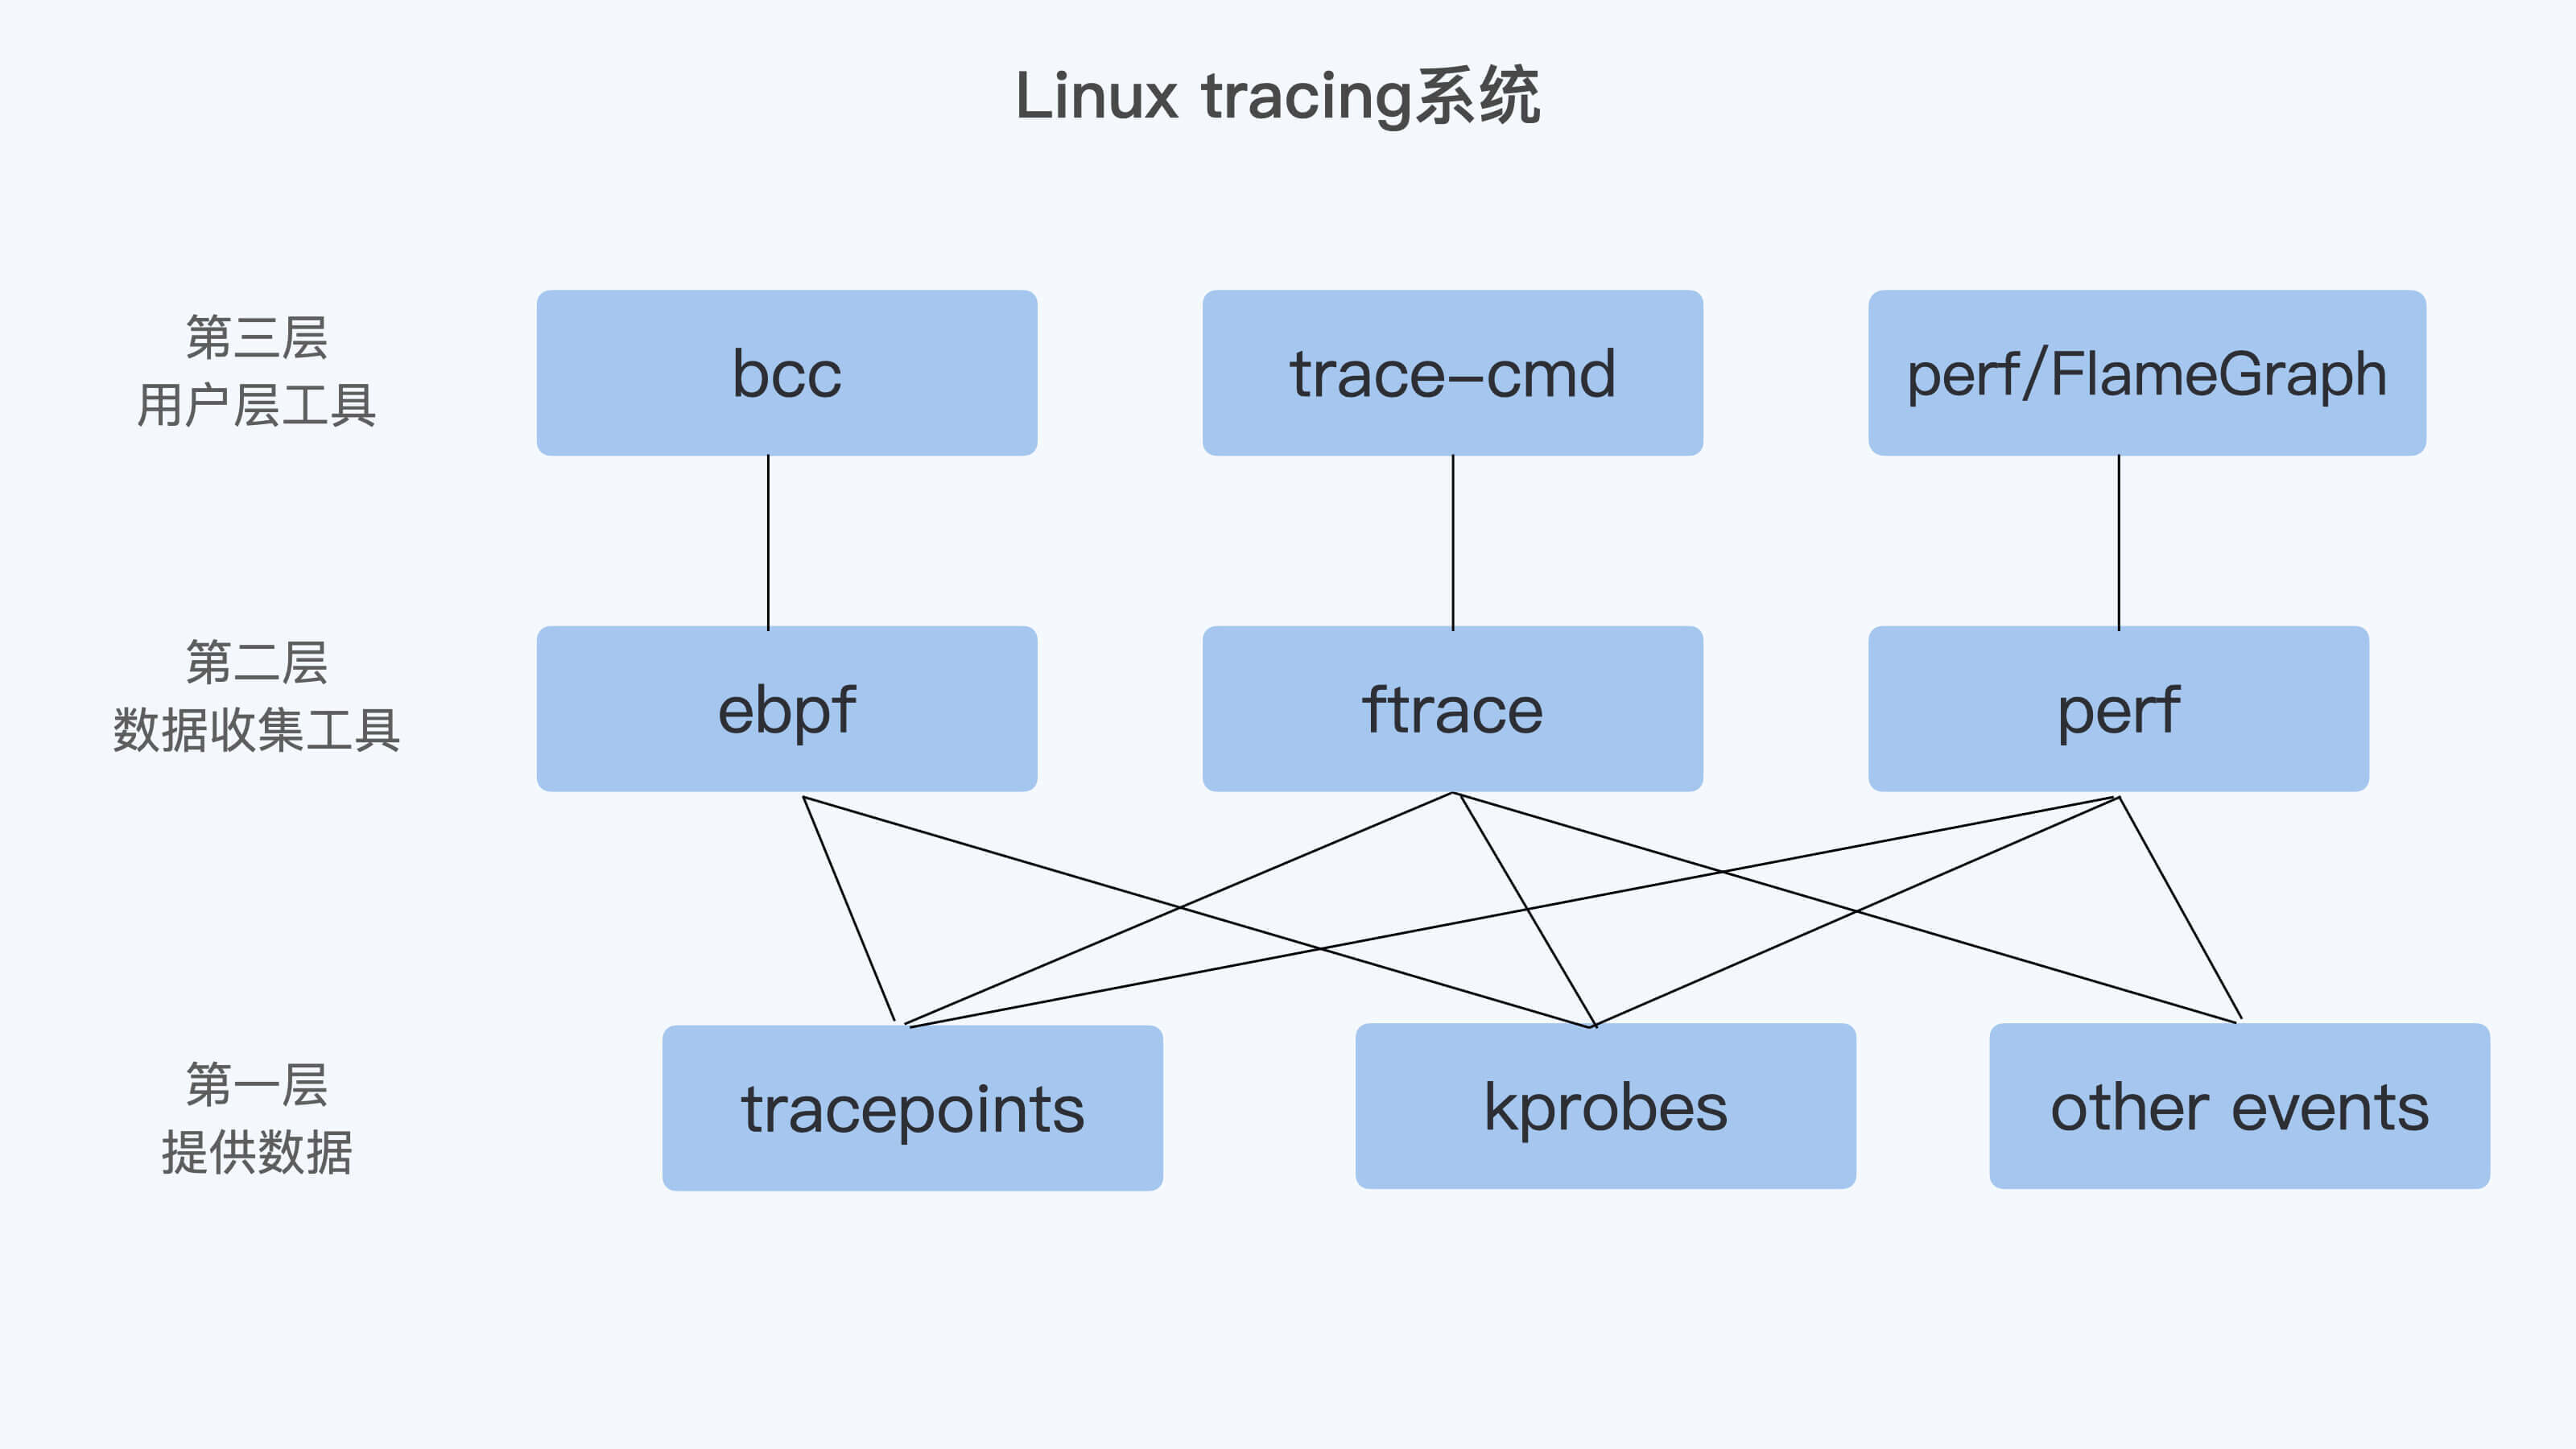
图片来自于:极客时间 容器高手实战
第一层是最基础的提供数据的机制,这里就包含了tracepoints、kprobes,还有一些别的events,比如perf使用的HW/SW events。
第二层是进行数据收集的工具,这里包含了ftrace、perf,还有ebpf。
第三层是用户层工具。
二、perf子命令简介
perf的功能通过子命令调用。作为常见用法示例,下面使用两个子命令:record用于检测事件并将其保存到文件,然后report用于汇总文件的内容。
(1)perf-record
NAME
perf-record - Run a command and record its profile into perf.data
DESCRIPTION
This command runs a command and gathers a performance counter profile from it, into perf.data - without displaying anything.
-a, --all-cpus
System-wide collection from all CPUs (default if no target is specified).
-F, --freq=
Profile at this frequency.
.......
--call-graph
Setup and enable call-graph (stack chain/backtrace) recording, implies -g. Default is "fp".
Allows specifying "fp" (frame pointer) or "dwarf"
(DWARF's CFI - Call Frame Information) or "lbr"
(Hardware Last Branch Record facility) as the method to collect
the information used to show the call graphs.
In some systems, where binaries are build with gcc
--fomit-frame-pointer, using the "fp" method will produce bogus
call graphs, using "dwarf", if available (perf tools linked to
the libunwind or libdw library) should be used instead.
Using the "lbr" method doesn't require any compiler options. It
will produce call graphs from the hardware LBR registers. The
main limitation is that it is only available on new Intel
platforms, such as Haswell. It can only get user call chain. It
doesn't work with branch stack sampling at the same time.
When "dwarf" recording is used, perf also records (user) stack dump
when sampled. Default size of the stack dump is 8192 (bytes).
User can change the size by passing the size after comma like
"--call-graph dwarf,4096".
......
其中–call-graph选项是一种用于设置和启用调用图(函数调用链/回溯)记录的选项。用于分析程序的调用图,即函数在执行过程中的调用关系。调用图对于理解程序的执行流程、识别热点函数和优化性能非常有用。通过对调用图进行分析,可以看到哪些函数被最频繁调用,它们之间的连接方式以及每个函数的执行时间。
–call-graph选项提供了不同的方法来收集调用图信息:
–call-graph=fp:使用帧指针fp(frame pointer)作为收集调用图信息的方法。这是默认的方法,但在一些使用gcc --fomit-frame-pointer构建的系统中,可能会产生错误的调用图。
–call-graph=dwarf:使用DWARF的CFI(Call Frame Information)作为收集调用图信息的方法。这需要perf工具链接到libunwind或libdw库,以便获取DWARF的信息。使用这种方法时,perf还会记录用户堆栈转储(stack dump)信息。默认堆栈转储大小为8192字节,可以在逗号后面指定自定义大小,例如–call-graph=dwarf,4096。
–call-graph=lbr:使用硬件的最后分支记录(Last Branch Record)功能作为收集调用图信息的方法。这种方法不需要编译器选项。它会从硬件的LBR寄存器中获取信息来生成调用图。但它只适用于新的Intel平台(如Haswell),而且只能获取用户代码的调用链。它无法与分支栈采样同时工作。
(2)perf-report
NAME
perf-report - Read perf.data (created by perf record) and display the profile
DESCRIPTION
This command displays the performance counter profile information recorded via perf record.
--stdio
Use the stdio interface.
(3)演示
[root@localhost ~]# perf record -F 99 -a -- sleep 30
[ perf record: Woken up 1 times to write data ]
[ perf record: Captured and wrote 0.686 MB perf.data (257 samples) ]
[root@localhost ~]# perf report --stdio
# To display the perf.data header info, please use --header/--header-only options.
#
#
# Total Lost Samples: 0
#
# Samples: 257 of event 'cycles:ppp'
# Event count (approx.): 2015944621
#
# Overhead Command Shared Object Symbol
# ........ ........... ....................... ...................................
#
20.82% perf [kernel.vmlinux] [k] unlink_anon_vmas
16.08% pool [kernel.vmlinux] [k] context_struct_compute_av
13.41% swapper [kernel.vmlinux] [k] exit_idle
12.53% perf [kernel.vmlinux] [k] generic_exec_single
2.80% bash bash [.] 0x000000000003e5c8
1.75% swapper [kernel.vmlinux] [k] intel_idle
1.37% pgrep [kernel.vmlinux] [k] pid_revalidate
0.89% bash [kernel.vmlinux] [.] irq_return
0.81% df [kernel.vmlinux] [k] error_swapgs
0.68% bash bash [.] 0x000000000003e5d0
0.66% pgrep [kernel.vmlinux] [k] _raw_spin_lock
0.55% swapper [kernel.vmlinux] [k] leave_mm
0.52% df [kernel.vmlinux] [.] irq_return
0.51% df [kernel.vmlinux] [k] symcmp
0.49% head [kernel.vmlinux] [k] get_vmalloc_info
0.46% who ld-2.17.so [.] strcmp
0.41% who [kernel.vmlinux] [k] vma_interval_tree_insert
0.41% who ld-2.17.so [.] _dl_runtime_resolve_xsavec
0.39% head ld-2.17.so [.] _dl_relocate_object
0.37% sleep [kernel.vmlinux] [k] __do_page_fault
0.35% pgrep [kernel.vmlinux] [k] avtab_search_node
0.35% who [kernel.vmlinux] [k] lookup_slow
0.34% tail [kernel.vmlinux] [k] clear_page_c_e
0.34% df [kernel.vmlinux] [k] mm_release
0.34% df libc-2.17.so [.] __gconv_transform_utf8_internal
0.33% df [kernel.vmlinux] [k] retint_userspace_restore_args
0.33% bash [kernel.vmlinux] [k] release_pages
0.33% sleep [kernel.vmlinux] [k] idle_balance
0.32% who [kernel.vmlinux] [.] irq_return
0.31% who ld-2.17.so [.] _dl_fixup
0.30% swapper [kernel.vmlinux] [k] pick_next_task_fair
0.30% who [kernel.vmlinux] [k] system_call
0.30% df [kernel.vmlinux] [k] link_path_walk
0.30% who [kernel.vmlinux] [k] error_swapgs
0.30% df [kernel.vmlinux] [k] __wake_up_bit
0.29% swapper [kernel.vmlinux] [k] cpuidle_enter_state
0.29% bash [kernel.vmlinux] [k] vm_normal_page
0.28% tail [kernel.vmlinux] [k] error_swapgs
0.26% head [kernel.vmlinux] [k] put_dec_trunc8
0.26% swapper [kernel.vmlinux] [k] int_sqrt
0.26% bash [kernel.vmlinux] [k] __mem_cgroup_uncharge_common
0.25% tail [kernel.vmlinux] [k] tlb_finish_mmu
这个特定的例子对在任何CPU上运行的任何程序以99赫兹采样30秒,然后显示最频繁采样的函数。
perf子命令如下所示:
annotate Read perf.data (created by perf record) and display annotated code
archive Create archive with object files with build-ids found in perf.data file
bench General framework for benchmark suites
buildid-cache Manage build-id cache.
buildid-list List the buildids in a perf.data file
c2c Shared Data C2C/HITM Analyzer.
config Get and set variables in a configuration file.
data Data file related processing
diff Read perf.data files and display the differential profile
evlist List the event names in a perf.data file
ftrace simple wrapper for kernel's ftrace functionality
inject Filter to augment the events stream with additional information
kallsyms Searches running kernel for symbols
kmem Tool to trace/measure kernel memory properties
kvm Tool to trace/measure kvm guest os
list List all symbolic event types
lock Analyze lock events
mem Profile memory accesses
record Run a command and record its profile into perf.data
report Read perf.data (created by perf record) and display the profile
sched Tool to trace/measure scheduler properties (latencies)
script Read perf.data (created by perf record) and display trace output
stat Run a command and gather performance counter statistics
test Runs sanity tests.
timechart Tool to visualize total system behavior during a workload
top System profiling tool.
probe Define new dynamic tracepoints
trace strace inspired tool
下图显示了常用的perf子命令及其数据源和输出类型: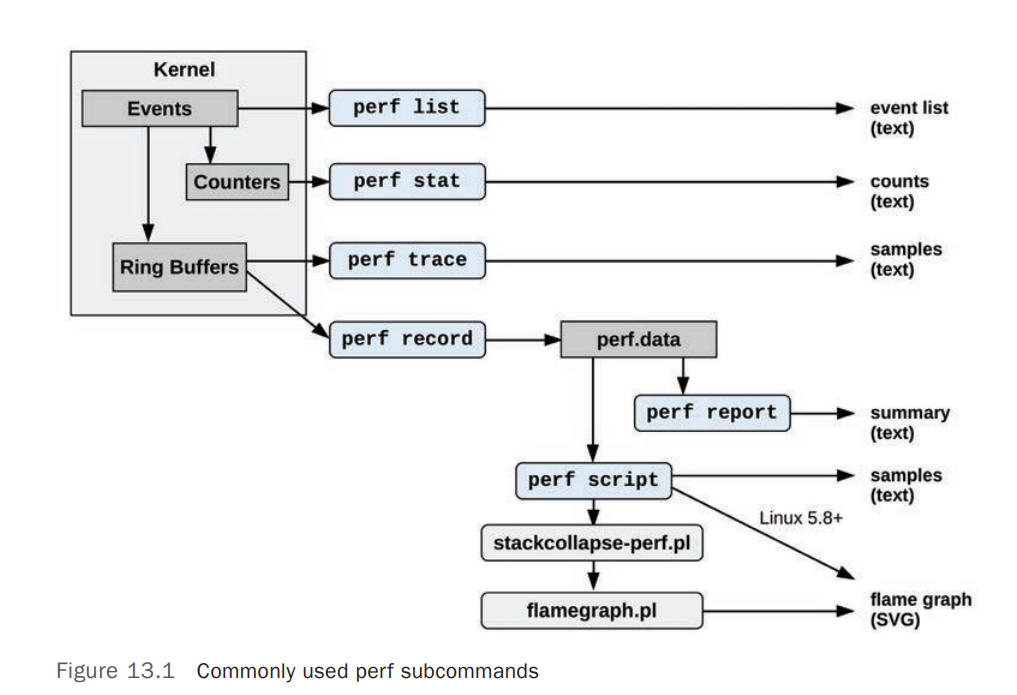
三、perf工作模式
perf_events提供三种工作模式:采样模式(sampling)、计数模式(counting)和 bpf programs。
perf record 命令工作在采样模式:周期性地做事件采样,将事件数据写入内核缓冲区,perf命令以缓慢的异步速率读取内核缓冲区以写入perf.data文件。然后,perf report或perf script命令读取此文件。
perf stat 命令工作在计数模式:仅仅统计内核上下文中的事件,其中计数的摘要由perf打印。此模式不会生成perf.data文件。
count只是记录了event的发生次数,sample记录了大量信息(比如:IP、ADDR、TID、TIME、CPU、BT)。
sample功能,需要给perf_event分配ringbuffer空间,并且把这部分空间通过mmap映射到用户空间。
bpf programs,这是Linux4.4+内核中的一个新功能,可以在内核空间中执行自定义用户定义的程序,可以执行有效的数据过滤和汇总。
这里先不讨论bpf programs on events。
尝试使用perf-stat命令开始计数事件,看看这是否足够。此子命令开销最小。
当使用带有perf记录的采样模式时,需要稍微注意开销,因为捕获文件可能会很快变成数百兆字节。这取决于正在跟踪的事件的速率:频率越高,开销越高,perf.data大小越大。
要真正减少开销并生成更高级的摘要,请编写由perf执行的BPF程序。
3.1 计数
计数就是统计某个event在一段时间里发生了多少次。
perf stat可以看到在这段时间里这些Hardware event发生的数目:
[root@localhost ~]# perf stat
^C
Performance counter stats for 'system wide':
24378.291792 cpu-clock (msec) # 3.999 CPUs utilized
855 context-switches # 0.035 K/sec
93 cpu-migrations # 0.004 K/sec
10,465 page-faults # 0.429 K/sec
147,631,390 cycles # 0.006 GHz
80,102,008 instructions # 0.54 insn per cycle
16,125,726 branches # 0.661 M/sec
835,656 branch-misses # 5.18% of all branches
6.095605891 seconds time elapsed
可以加上"-e"参数,指定某一个event来看它的计数,比如page-faults,这里我们看到在当前CPU上,这个event在1秒钟内发生了177次:
-e, --event=
Select the PMU event.
[root@localhost ~]# perf stat -e page-faults -- sleep 1
Performance counter stats for 'sleep 1':
177 page-faults
1.001049846 seconds time elapsed
其它的计数事件:
# CPU counter statistics for the specified command:
perf stat command
# Detailed CPU counter statistics (includes extras) for the specified command:
perf stat -d command
# CPU counter statistics for the specified PID, until Ctrl-C:
perf stat -p PID
# CPU counter statistics for the entire system, for 5 seconds:
perf stat -a sleep 5
# Various basic CPU statistics, system wide, for 10 seconds:
perf stat -e cycles,instructions,cache-references,cache-misses,bus-cycles -a sleep 10
# Various CPU level 1 data cache statistics for the specified command:
perf stat -e L1-dcache-loads,L1-dcache-load-misses,L1-dcache-stores command
# Various CPU data TLB statistics for the specified command:
perf stat -e dTLB-loads,dTLB-load-misses,dTLB-prefetch-misses command
# Various CPU last level cache statistics for the specified command:
perf stat -e LLC-loads,LLC-load-misses,LLC-stores,LLC-prefetches command
# Using raw PMC counters, eg, counting unhalted core cycles:
perf stat -e r003c -a sleep 5
# PMCs: counting cycles and frontend stalls via raw specification:
perf stat -e cycles -e cpu/event=0x0e,umask=0x01,inv,cmask=0x01/ -a sleep 5
# Count syscalls per-second system-wide:
perf stat -e raw_syscalls:sys_enter -I 1000 -a
# Count system calls by type for the specified PID, until Ctrl-C:
perf stat -e 'syscalls:sys_enter_*' -p PID
# Count system calls by type for the entire system, for 5 seconds:
perf stat -e 'syscalls:sys_enter_*' -a sleep 5
# Count scheduler events for the specified PID, until Ctrl-C:
perf stat -e 'sched:*' -p PID
# Count scheduler events for the specified PID, for 10 seconds:
perf stat -e 'sched:*' -p PID sleep 10
# Count ext4 events for the entire system, for 10 seconds:
perf stat -e 'ext4:*' -a sleep 10
# Count block device I/O events for the entire system, for 10 seconds:
perf stat -e 'block:*' -a sleep 10
# Count all vmscan events, printing a report every second:
perf stat -e 'vmscan:*' -a -I 1000
3.2 采样
perf record 在不加 -e 指定event的时候,它缺省的event就是Hardware event cycles。我们先用 perf stat来查看1秒钟cycles事件的数量,在下面的例子里这个数量是1,385,279次。
[root@localhost ~]# perf stat -e cycles -- sleep 1
Performance counter stats for 'sleep 1':
1,385,279 cycles
1.000915487 seconds time elapsed
如果每次cycles event发生的时候,我们都记录当时的IP(就是处理器当时要执行的指令地址)、IP所属的进程等信息的话,这样系统的开销就太大了。所以perf就使用了对event采样的方式来记录IP、进程等信息。
perf对event的采样有两种模式:
第一种是按照event的数目(period),比如每发生10000次cycles event就记录一次IP、进程等信息, perf record 中的 -c 参数可以指定每发生多少次,就做一次记录。
比如在下面的例子里,我们指定了每10000 cycles event做一次采样之后,在1秒里总共就做了59次采样,比我们之前看到1秒钟1,385,279次cycles的次数要少多了。
[root@localhost ~]# perf record -e cycles -c 10000 -- sleep 1
[ perf record: Woken up 1 times to write data ]
[ perf record: Captured and wrote 0.019 MB perf.data (59 samples) ]
第二种是定义一个频率(frequency), perf record 中的 -F 参数就是指定频率的,比如 perf record -e cycles -F 99 – sleep 1 ,就是指采样每秒钟做99次。
在 perf record 运行结束后,会在磁盘的当前目录留下perf.data这个文件,里面记录了所有采样得到的信息。然后我们再运行 perf report 命令,查看函数或者指令在这些采样里的分布比例。
其它的一些采样例子:
# Sample on-CPU functions for the specified command, at 99 Hertz:
perf record -F 99 command
# Sample on-CPU functions for the specified PID, at 99 Hertz, until Ctrl-C:
perf record -F 99 -p PID
# Sample on-CPU functions for the specified PID, at 99 Hertz, for 10 seconds:
perf record -F 99 -p PID sleep 10
# Sample CPU stack traces (via frame pointers) for the specified PID, at 99 Hertz, for 10 seconds:
perf record -F 99 -p PID -g -- sleep 10
# Sample CPU stack traces for the PID, using dwarf (dbg info) to unwind stacks, at 99 Hertz, for 10 seconds:
perf record -F 99 -p PID --call-graph dwarf sleep 10
# Sample CPU stack traces for the entire system, at 99 Hertz, for 10 seconds (< Linux 4.11):
perf record -F 99 -ag -- sleep 10
# Sample CPU stack traces for the entire system, at 99 Hertz, for 10 seconds (>= Linux 4.11):
perf record -F 99 -g -- sleep 10
# If the previous command didn't work, try forcing perf to use the cpu-clock event:
perf record -F 99 -e cpu-clock -ag -- sleep 10
# Sample CPU stack traces for a container identified by its /sys/fs/cgroup/perf_event cgroup:
perf record -F 99 -e cpu-clock --cgroup=docker/1d567f4393190204...etc... -a -- sleep 10
# Sample CPU stack traces for the entire system, with dwarf stacks, at 99 Hertz, for 10 seconds:
perf record -F 99 -a --call-graph dwarf sleep 10
# Sample CPU stack traces for the entire system, using last branch record for stacks, ... (>= Linux 4.?):
perf record -F 99 -a --call-graph lbr sleep 10
# Sample CPU stack traces, once every 10,000 Level 1 data cache misses, for 5 seconds:
perf record -e L1-dcache-load-misses -c 10000 -ag -- sleep 5
# Sample CPU stack traces, once every 100 last level cache misses, for 5 seconds:
perf record -e LLC-load-misses -c 100 -ag -- sleep 5
# Sample on-CPU kernel instructions, for 5 seconds:
perf record -e cycles:k -a -- sleep 5
# Sample on-CPU user instructions, for 5 seconds:
perf record -e cycles:u -a -- sleep 5
# Sample on-CPU user instructions precisely (using PEBS), for 5 seconds:
perf record -e cycles:up -a -- sleep 5
# Perform branch tracing (needs HW support), for 1 second:
perf record -b -a sleep 1
# Sample CPUs at 49 Hertz, and show top addresses and symbols, live (no perf.data file):
perf top -F 49
# Sample CPUs at 49 Hertz, and show top process names and segments, live:
perf top -F 49 -ns comm,dso
参考资料
https://www.brendangregg.com/perf.html
https://perf.wiki.kernel.org/index.php/Main_Page
https://www.cnblogs.com/arnoldlu/p/6241297.html
Systems.Performance.Enterprise.and.the.Cloud.2nd.Edition.2020.12

腾讯云面向开发者汇聚海量精品云计算使用和开发经验,营造开放的云计算技术生态圈。
更多推荐


 6
6 0
0- 0


 已为社区贡献10条内容

所有评论(0)