
PyTorch深度学习实践03——梯度下降算法
PyTorch深度学习实践第三节
·
- 上一节中,对于权重参数w的更新策略,我们采用的是穷举法。
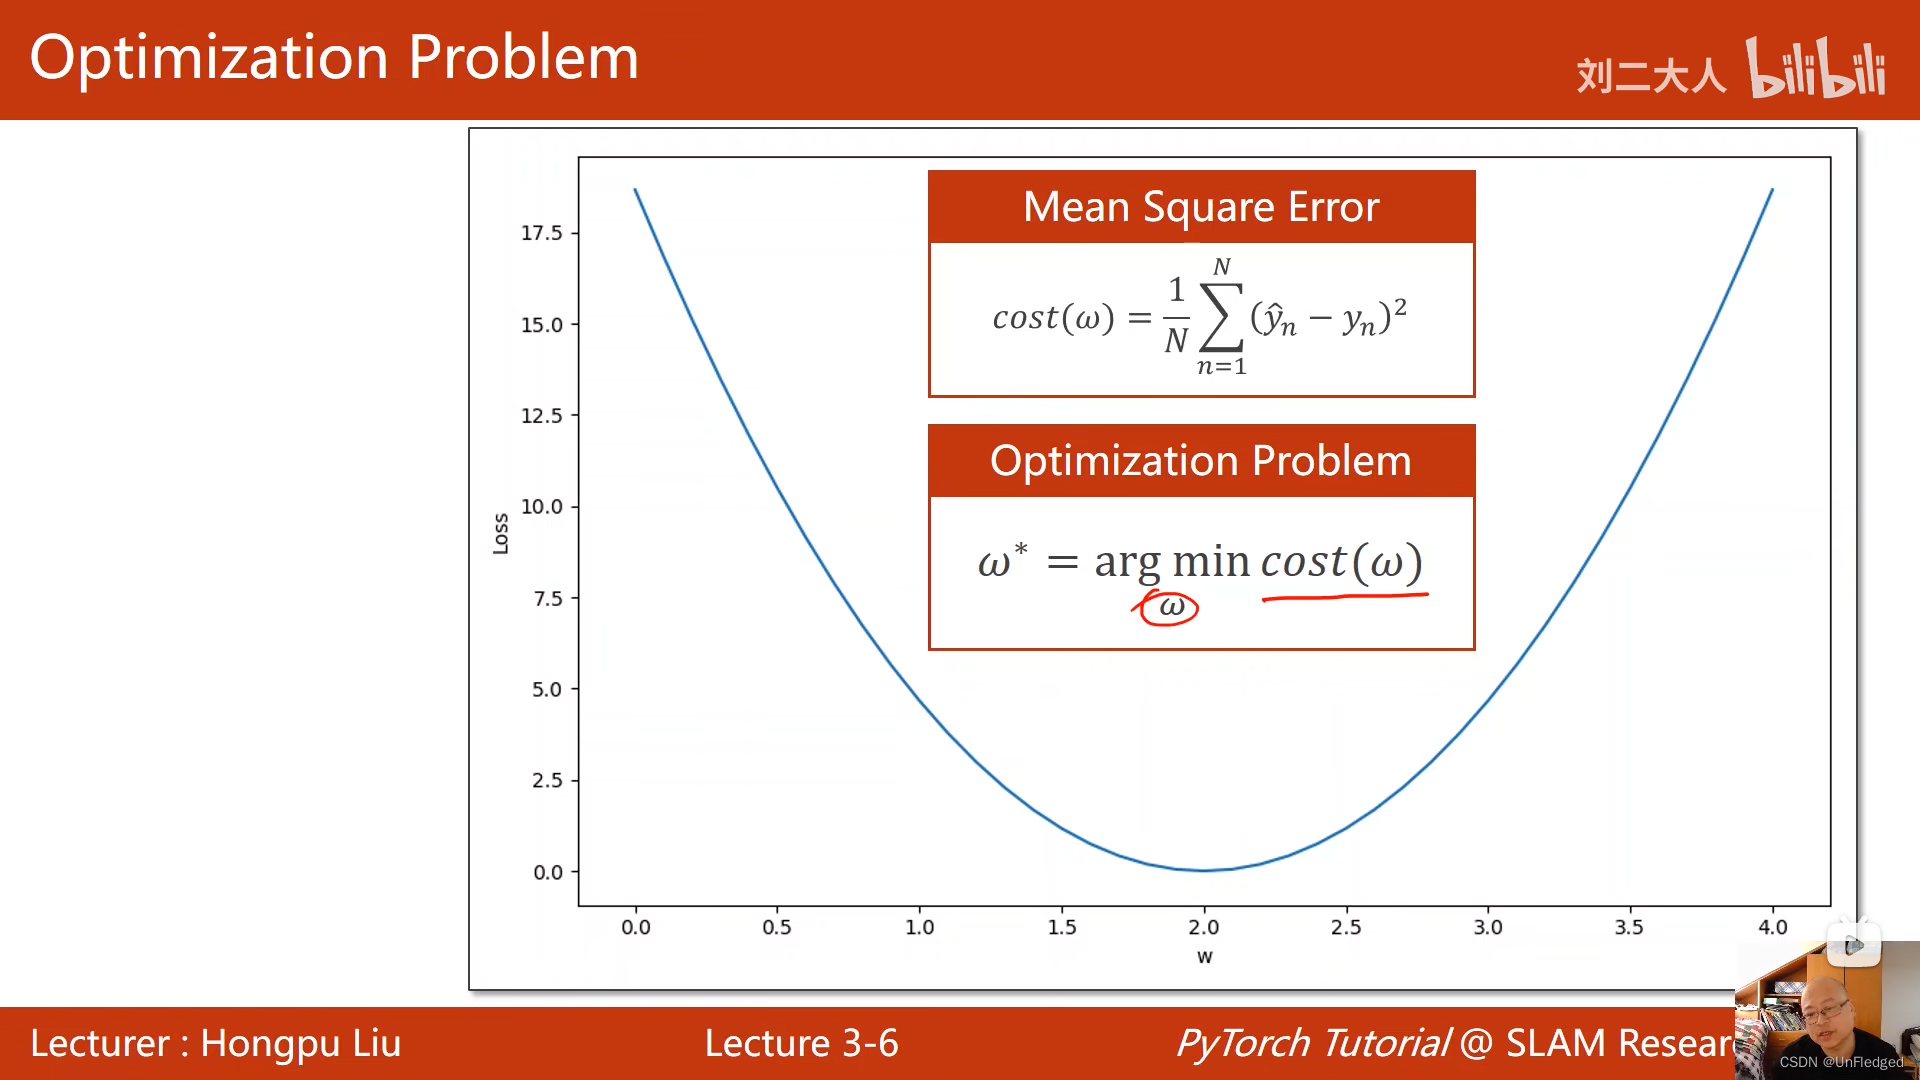
- 本节学习使用梯度下降算法自动更新权重,目标是求出使cost最小的权重组合
优化问题:求解使得目标函数(cost)最小的权重组合的任务(即第二行式子所示)
梯度下降(GD)、随机梯度下降(SGD),小批量随机梯度下降(mini-batch-SGD)
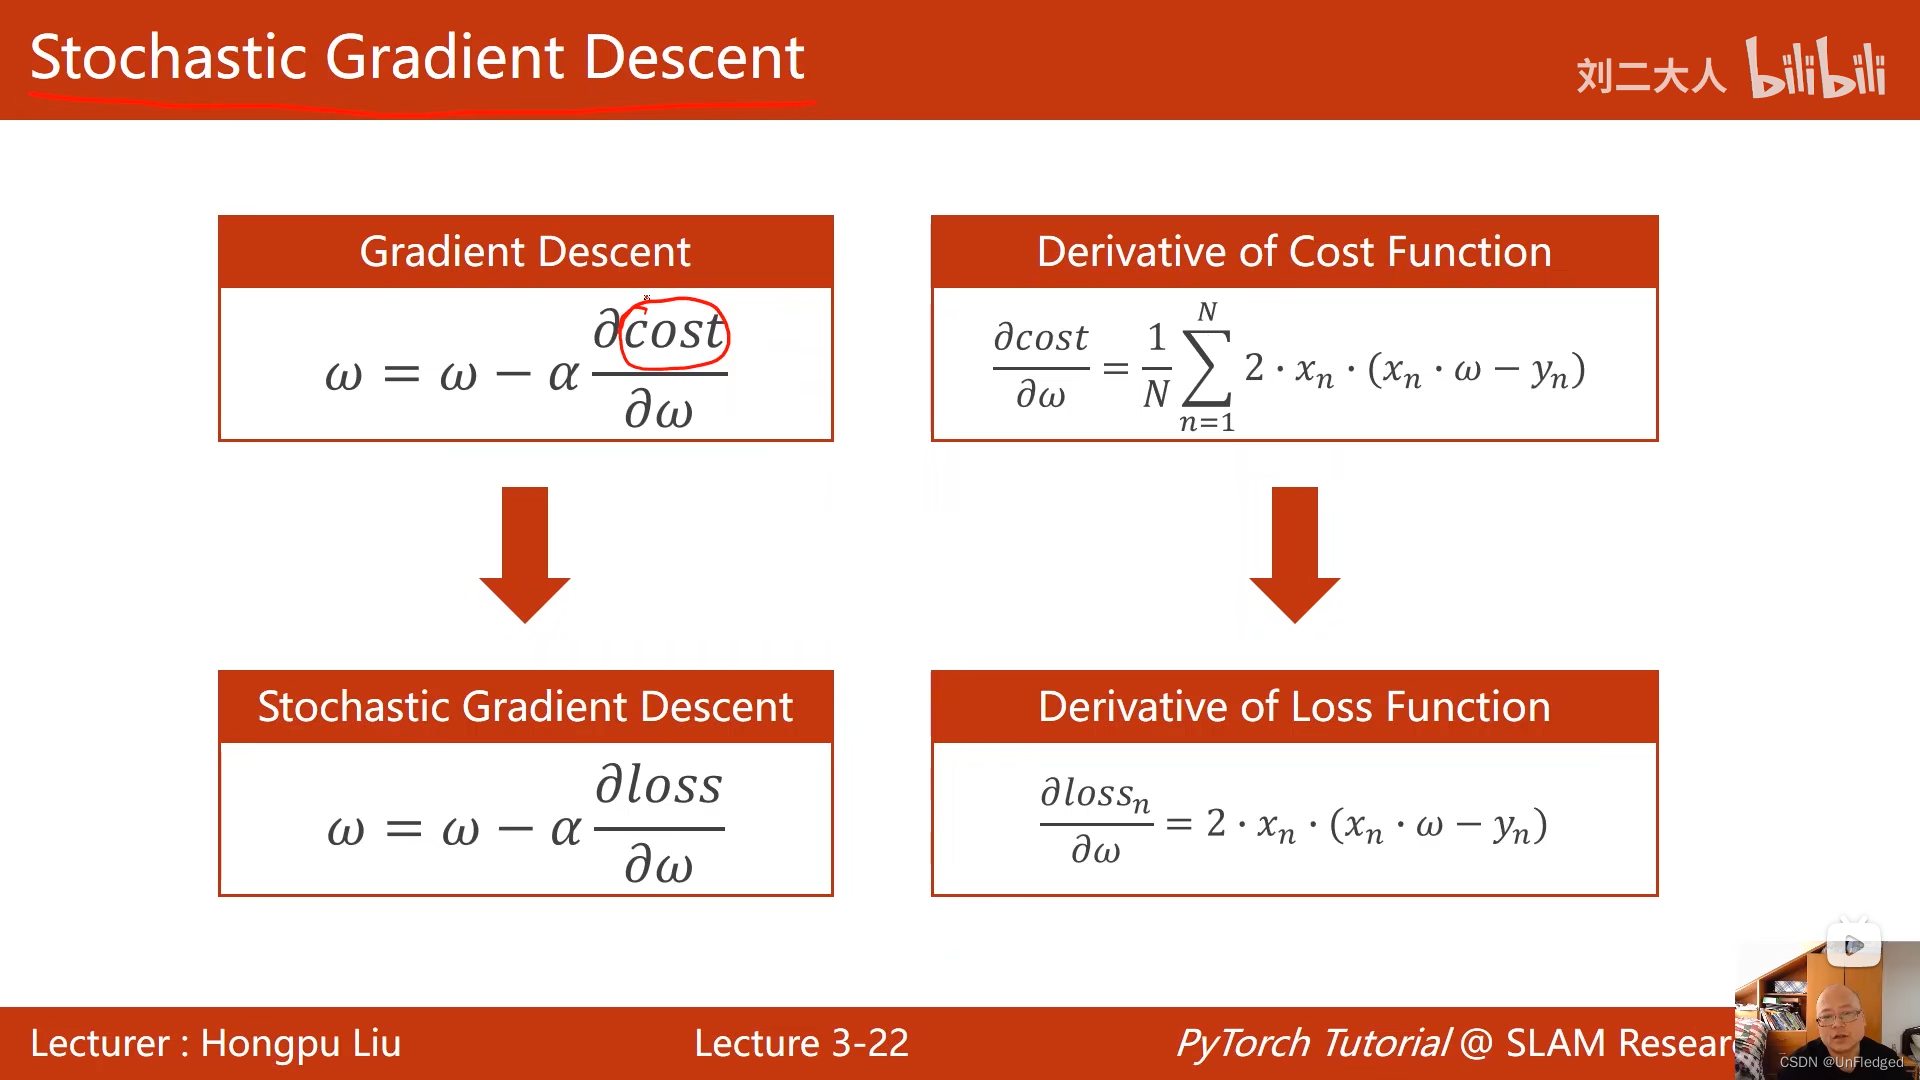
- 梯度下降:用所有样本的平均损失来作为求偏导的依据
- 随机梯度下降:用单个样本的loss作为求偏导的依据
- 小批量随机梯度下降:梯度下降运算性能好(可以利用并行性),随机梯度下降计算性能好(有可能脱离鞍点),为了中和两种效果,若干个样本为一组,对每组进行随机梯度下降

注:batch指的是所有样本,mini-batch指的才是上图中蓝框所示的小批量样本
梯度下降实现:
import numpy as np
import matplotlib.pyplot as plt

# define dataset
x_data = [1.0, 2.0, 3.0]
y_data = [2.0, 4.0, 6.0]

# initial guess of weight
w = 1.0

# define the model (前馈函数)
def forward(x):
    return x * w

# define cost function
def cost(xs, ys):
    cost = 0
    for x, y in zip(xs, ys):
        y_pred = forward(x)
        loss = (y_pred - y) ** 2
        cost += loss
    return cost / len(xs)

def gradient(xs, ys):
    grad = 0
    for x, y in zip(xs, ys):
        grad += 2 * x * (x * w - y)
    return grad / len(xs)

cost_list = []
epoch_list = []
print("Predict (before training)", 4, forward(4))
for epoch in range(100):
    epoch_list.append(epoch)
    cost_val = cost(x_data, y_data)
    cost_list.append(cost_val)
    gradient_val = gradient(x_data, y_data)
    w -= 0.01 * gradient_val
    print("Epoch:", epoch, "w=", w, "loss=", cost_val)

print("Prediction (after training)", 4, forward(4))

plt.plot(epoch_list, cost_list)
plt.xlabel("epoch")
plt.ylabel("cost")
plt.show()
随机梯度下降实现:
import numpy as np
import matplotlib.pyplot as plt

x_data = [1.0, 2.0, 3.0]
y_data = [4.0, 5.0, 6.0]

w = 1.0

def forward(x):
    return x * w

def loss(x, y):
    y_pred = forward(x)
    return (y_pred - y) ** 2

def gradient(x, y):
    y_pred = forward(x)
    return 2 * x * (y_pred - y)

loss_list = []
epoch_list = []
print("Predict (before training)", 4, forward(4))
for epoch in range(100):
    epoch_list.append(epoch)
    for x, y in zip(x_data, y_data):
        loss_val = loss(x, y)
        grad = gradient(x, y)
        w -= 0.01 * grad
        print("\tgrad:",x, y, grad)

    print("Progress:",epoch, "w=", w, "Loss = ", loss_val)
    loss_list.append(loss_val)
print("Predict (after training)", 4, forward(4))

plt.plot(epoch_list, loss_list)
plt.xlabel("Epoch")
plt.ylabel("Loss")
plt.show()
更多推荐


 1
1 0
0- 0


 已为社区贡献1条内容

所有评论(0)