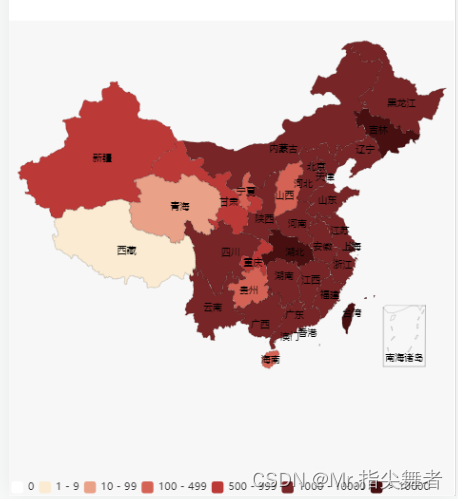
如何用axios调接口数据赋给echarts(中国疫情地图)
如何用axios调接口数据赋给echarts(中国疫情地图)
·
在做项目时候,使用axios调后台接口数据赋值给echarts中,一直存在bug,数据赋值不上去,找了好久才发现是异步的问题
1.首先先导入所需的插件
import echarts from "echarts";
// 导入地图模块,这个存在于node_modules中echarts目录下
import "echarts/map/js/china";
import axios from "axios";
2.
mounted() {
    this.getmap(); //获取地图
    // this.getmapdata(); //获取地图数据
  },
  methods: {
    getmap() {
      //
      axios.get(base.mapurl).then((res) => {
        let city = res.data.retdata;
        for (let i = 0; i < city.length; i++) {
          let obj = {};
          obj.name = city[i].xArea;
          obj.value = city[i].confirm; //累计确诊的人数  curConfirm当前确诊人数
          this.arr.push(obj);
        }
        console.log("城市确诊数据", this.arr);
        myChart.setOption(option);  //重点一定在数据请求完在调用
      });
      var myChart = echarts.init(document.getElementById("main"));

      // 绘制图表
      var option = {
        tooltip: {
          //悬浮弹框
          triggerOn: "click", //提示框触发的条件
          enterable: true, //鼠标是否可进入提示框浮层中,默认为false
          formatter(item) {
            //item=下面serves里面的data里面的每一项 //[{} ] data={} a b c d
            return (
              '<a href="#/citys/' +
              item.name +
              '" style="color:#fff">省份:' +
              item.name +
              "--详情</a>"
            );
          },
        },
        visualMap: [
          {
            //映射高亮颜色
            orient: "horizontal", //水平的
            type: "piecewise", //离散
            bottom: 0,
            textGap: 4,
            itemGap: 4,
            itemWidth: 10,
            itemHeight: 10,
            padding: 2,
            textStyle: {
              fontSize: 9,
            },
            pieces: [
              // 配置颜色区间
              {
                min: 0,
                max: 0,
                color: "#FFFFFF",
              },
              {
                min: 1,
                max: 9,
                color: "#FAEBD2",
              },
              {
                min: 10,
                max: 99,
                color: "#E9A188",
              },
              {
                min: 100,
                max: 499,
                color: "#D56355",
              },
              {
                min: 500,
                max: 999,
                color: "#BB3937",
              },
              {
                min: 1000,
                max: 10000,
                color: "#772526",
              },
              {
                min: 10000,
                color: "#480F10",
              },
            ],
          },
        ],
        series: [
          {
            name: "省",
            type: "map", //地图  bar  line  map
            map: "china", //中国地图 需要引入地图china.js
            roam: false,
            zoom: 1.2,
            aspectScale: 0.75,
            top: 40,
            layoutCenter: ["5%", "5%"],
            label: {
              normal: {
                show: true,
                textStyle: {
                  fontSize: 8,
                },
              },
            },
            itemStyle: {
              normal: {
                areaColor: "rgba(0,255,236,0)",
                borderColor: "rgba(0,0,0,0.2)",
              },
              emphasis: {
                // 选中的区域颜色及阴影效果等
                areaColor: "rgba(255,180,0,0.8)",
                shadowOffsetX: 0,
                shadowOffsetY: 0,
                shadowBlur: 20,
                borderWidth: 0,
              },
            },
            data: this.arr,

            // data: [
            //   { name: "内蒙古", value: 200 },
            //   { name: "北京", value: 800 },
            // ],
          },
        ],
      };

      // myChart.setOption(option);
    },
}
注意:把整个函数放到mounted()进行调用,在进行完axios调用后要 myChart.setOption(option);进行重新渲染数据才能出来,

为开发者提供学习成长、分享交流、生态实践、资源工具等服务,帮助开发者快速成长。
更多推荐


 18
18 0
0- 0


 已为社区贡献7条内容

所有评论(0)