echars实现全流程图
流程图效果图如下可自己添加节点,更改数据流等,数据流是动画的方式进行节点间流动步骤如下:1.vue引入echars终端下载echartsnpm install echarts@4.8.0 --save2.在main.js中引入import echarts from "echarts"Vue.prototype.$echarts = echarts;3.在组件中代码如下(已标注)<templa
·
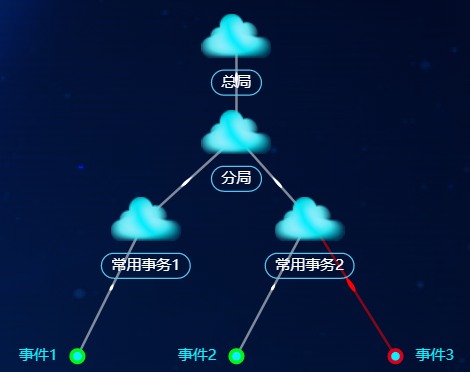
流程图效果图如下

可自己添加节点,更改数据流等,数据流是动画的方式进行节点间流动
步骤如下:
1.vue引入echars
终端下载echarts
npm install echarts@4.8.0 --save
2.在main.js中引入
import echarts from "echarts"
Vue.prototype.$echarts = echarts;
3.在组件中代码如下(已标注)
<template>
  <div class="server">
    <div id="servermsg" ref="chart" style="height: 100%"></div>
  </div>
</template>

<script>
import * as echarts from "echarts";
export default {
  components: {},
  data() {
    return {};
  },
  computed: {},
  watch: {},
  methods: {
    initData: function () {
      var chartDom = this.$refs.chart;
      const resizeDiv = document.getElementById("servermsg");
      console.log("hahah" + document.getElementById("servermsg").offsetWidth);
      const myChart = echarts.init(chartDom, "", {
        width: document.getElementById("servermsg").offsetWidth,
      });
      let [dataArr, allArr, erArr, sanArr] = [[], [], [], []];
      //erArr数组中存放云的详细信息
      //allArr孩子节点
      //sanArr 存放球的信息
      // 行为标注 show first row
      let option = [
        {
          symbol: "",
          name: "事件3",
          pointType: "point",
          belong: "常用事务2",
          pointColor: "rgba(217, 0, 27, 1)", // 球颜色
          lineStyle: {
            color: "red", // 线颜色
          },
          effect: {
            period: 2, // 箭头快慢
            symbolSize: [6, 20], // 箭头大小
          },
        },
        {
          symbol: "",
          name: "事件2",
          pointType: "point",
          belong: "常用事务2",
        },
        {
          symbol: "",
          name: "事件1",
          pointType: "point",
          belong: "常用事务1",
        },
        {
          symbol: "",
          name: "总局",
        //   pointType: "cloudtwo",
        //   belong: "信息中心",
        },
        {
          symbol: "",
          name: "常用事务2",
          pointType: "cloud",
        },
        {
          symbol: "",
          //   name: "空气污染扩散气象条件",
          name: "常用事务1",
          pointType: "cloud",
        },
        {
          symbol: "",
          name: "分局",
          ppp:"123"
        //   pointType: "cloud",
          // lineStyle: {
          //   color: 'red', // 线颜色
          // },
        },
      ];
      // 点
      option.forEach((el, ind) => {
        //云的样式
        if (el.pointType === "cloud") {
          // 云
          el.symbol =
            "assess/img1";//这里放置节点如上图中云图案的图片
          el.symbolSize = [56, 35]; //云的大小
          el.label = {
            normal: {
              show: true,
              position: "bottom",
              borderWidth: 1,
              borderRadius: 12,
              padding: [4, 8, 4, 8],
              distance: 10,
              color: "rgb(255,255,255)",
              borderColor: "rgb(89,197,238)",
            },
          }; //设置云的大小
          erArr.push(el); //erArr数组中存放云的详细信息
        } else if (el.pointType === "point") {
          // 球
          el.itemStyle = {
            borderColor: el.pointColor ? el.pointColor : "rgba(4, 242, 28, 1)",
            borderWidth: 3,
            color: "#0ceffd",
          };
          sanArr.push(el); //存放球的信息
        } //球的样式
        else if (!el.pointType) {//设置总局的图标
          // 云
          el.symbol =
            "assess/img1";//这里放置节点如上图中云图案的图片
          el.symbolSize = [56, 35]; //云的大小
          el.label = {
            normal: {
              show: true,
              position: "bottom",
              borderWidth: 1,
              borderRadius: 12,
              padding: [4, 8, 4, 8],
              distance: 10,
              color: "rgb(255,255,255)",
              borderColor: "rgb(89,197,238)",
            },
          }; //设置云的大小
          erArr.push(el); //erArr数组中存放云的详细信息
        }

        if (!el.belong) {
          el.children = [];
          option.forEach((es) => {
            if (es.belong === el.name) {
              el.children.push(es);
            }
          });
          allArr.push(el);
        } //allArr孩子节点
      });

      // 设置云的圆形分区
      function group(arr, r) {
        const newArray = [];
        const { length: arLen } = arr;
        arr.forEach((e, ind) => {
          if (e.pointType) {
            // 按角度均匀分布
            const ang = 90 - (360 / arLen).toFixed(2) * (ind + 1);
            const x = Math.cos((ang * Math.PI) / -260).toFixed(2) * r;
            const y = -10
            e.value = [x.toFixed(2), y.toFixed(2)];
            if (e.belong) {
              let rotate = "";
              e.label = {
                show: true,
                width: 200,
                color: {
                  lineColor: {
                    color: "rgb(24,163,239)",
                  },
                },
                rotate,
              };
            }
            newArray.push(e);
          }else if(e.ppp){//自定义信息中心的位置
            const ang = 90 - (360 / arLen).toFixed(2) * (ind + 1);
            const x = 0;
            const y = 9;
            e.value = [x.toFixed(2), y.toFixed(2)];
            if (e.belong) {
              let rotate = "";
              e.label = {
                show: true,
                width: 200,
                color: {
                  lineColor: {
                    color: "rgb(24,163,239)",
                  },
                },
                  rotate,
              align: x > 0 ? "left" : "right",
              padding: x > 0 ? [0, 0, 0, 16] : [0, 16, 0, 0],
              };
            }
            newArray.push(e);
          }
          else{//设置总局的位置
            const ang = 90 - (360 / arLen).toFixed(2) * (ind + 1);
            const x = 0;
            const y = 30;
            e.value = [x.toFixed(2), y.toFixed(2)];
            if (e.belong) {
              let rotate = "";
              e.label = {
                show: true,
                width: 200,
                color: {
                  lineColor: {
                    color: "rgb(24,163,239)",
                  },
                },
                  rotate,
              align: x > 0 ? "left" : "right",
              padding: x > 0 ? [0, 0, 0, 16] : [0, 16, 0, 0],
              };
            }
            newArray.push(e);
          }


        });
        return newArray;
      }
      // 设置线的分布
      function hhh(arr, r) {
        const newArray = [];
        const { length: arLen } = arr;
        arr.forEach((e, ind) => {
          // 按角度均匀分布
          const ang = 90 - (360 / arLen).toFixed(2) * (ind + 1);
          console.log("ang" + ang, "r" + r);
          const x = Math.cos((ang * Math.PI) / -300).toFixed(1) * r;
          const y = -40;
          console.log(x, y);
          e.value = [x.toFixed(2), y.toFixed(2)];
          if (e.belong) {
            let rotate = "";
            e.label = {
              //设置字的位置
              show: true,
              width: 200,
              color: {
                lineColor: {
                  color: "rgb(24,163,239)",
                },
              },
              rotate,
              align: x > 0 ? "left" : "right",
              padding: x > 0 ? [0, 0, 0, 16] : [0, 16, 0, 0],
            };
          }
          newArray.push(e);
        });
        return newArray;
      }
      // 线配置
      function linesConfig(arr) {
        const [dataArr, targetCoord] = [[], [0, 8]]; //原点坐标
        arr.forEach((el) => {
          if (!el.belong) {
            // 设置中心点到子节点的样式
            dataArr.push([
              { coord: targetCoord },
              {
                coord: el.value,
                lineStyle: el.lineStyle,
                effect: {
                  symbolSize: [4, 16], // 动画的大小
                  period: 6, // 时间快慢
                  delay: 2, // 延时计算
                  ...el.effect,
                },
              },
            ]);
            //设置父节点到子节点的线样式(速度大小等)
            arr.forEach((element) => {
              if (element.belong === el.name) {
                dataArr.push([
                  { coord: el.value },
                  {
                    coord: element.value,
                    lineStyle: element.lineStyle,
                    effect: {
                      symbolSize: [4, 8], // 动画的大小
                      period: 6, // 时间快慢
                      delay: 2, // 延时计算
                      ...element.effect,
                    },
                  },
                ]);
              }
            });
          }
        });
        return dataArr;
      }
       // 云和球的分布
      erArr = group(erArr, 50); //云
      sanArr = hhh(sanArr, 50); //球
      allArr = [...erArr, ...sanArr];
      // 线坐标和配置
      dataArr = linesConfig(allArr);
      option = {
        //   backgroundColor: '#fff',
        xAxis: {
          show: false,
          type: "value",
          max: 50,
          min: -51,
        },
        grid: {
          top: 35,
          bottom: 10,
          left: 65,
          right: 70,
        },
        yAxis: {
          show: false,
          type: "value",
          max: 30,
          min: -50,
        },
        series: [
          {
            type: "graph",
            coordinateSystem: "cartesian2d",
            z: 2,
            itemStyle: {
              normal: {
                shadowColor: "none",
              },
            },
            data: allArr,
          },
          {
            name: "",
            type: "lines",
            coordinateSystem: "cartesian2d",
            polyline: true,
            z: 1,
            lineStyle: {
              width: 2,
              color: "#fff",
              curveness: 0,
            },
            effect: {
              show: true,
              smooth: false,
              trailLength: 0, // 拖尾的长度
              symbol: "pin", // 动画的类型
            },
            data: dataArr,
          },
        ],
      };

      myChart.setOption(option);
    },
  },
};
</script>
<style lang='scss' scoped>
//@import url(); 引入公共css类
.server {
  width: 100%;
  height: 100%;
}
</style>
通过设置旋转角度,中心点位置,数据流的父子节点见流动,以及节点边缘样式完成

前往低代码交流专区
更多推荐

 2
2 0
0- 0


 已为社区贡献7条内容

所有评论(0)