深度学习PyTorch笔记(10):PyTorch绘制函数图像及切线
PyTorch绘制函数图像及切线学习自DIVE INTO DEEP LEARNING,当时学的时候没运行成功,就是因为d2l的导入问题,现在用pip install d2l搞好了,所以干脆把这里面的代码拿出来学习一遍。#pip install d2l安装d2l这个包,这是重点,要不然后面编译不出%matplotlib inlineimport numpy as npfrom IPython imp
深度学习PyTorch笔记(10):PyTorch绘制函数图像及切线
这是《动手学深度学习》(PyTorch版)(Dive-into-DL-PyTorch)的学习笔记,里面有一些代码是我自己拓展的。
其他笔记在专栏 深度学习 中。
学习自DIVE INTO DEEP LEARNING,当时学的时候没运行成功,就是因为d2l的导入问题,现在用pip install d2l搞好了,所以干脆把这里面的代码拿出来学习一遍。不过d2l这个包是他们团队自己写的。
#pip install d2l 安装d2l这个包,这是重点,要不然后面编译不出
%matplotlib inline #在plot时,默认嵌入到notebook里面
import numpy as np
from IPython import display
from d2l import torch as d2l
def f(x):
return 3 * x ** 2 - 4 * x
def numerical_lim(f, x, h):
return (f(x + h) - f(x)) / h
h = 0.1
for i in range(5):
print(f'h={h:.5f}, numerical limit={numerical_lim(f, 1, h):.5f}')
h *= 0.1
h=0.10000, numerical limit=2.30000
h=0.01000, numerical limit=2.03000
h=0.00100, numerical limit=2.00300
h=0.00010, numerical limit=2.00030
h=0.00001, numerical limit=2.00003
注意,注释#@save是一个特殊的标记,会将对应的函数、类或语句保存在d2l包中 因此,以后无须重新定义就可以直接调用它们(例如,d2l.use_svg_display())。
def use_svg_display(): #@save
"""使用svg格式在Jupyter中显示绘图。"""
display.set_matplotlib_formats('svg')
我们定义set_figsize函数来设置图表大小。注意,这里我们直接使用d2l.plt,因为导入语句from matplotlib import pyplot as plt已在前言中标记为保存到d2l包中。
def set_figsize(figsize=(3.5, 2.5)): #@save
"""设置matplotlib的图表大小。"""
use_svg_display()
d2l.plt.rcParams['figure.figsize'] = figsize
下面的set_axes函数用于设置由matplotlib生成图表的轴的属性。
#@save
def set_axes(axes, xlabel, ylabel, xlim, ylim, xscale, yscale, legend):
"""设置matplotlib的轴。"""
axes.set_xlabel(xlabel)
axes.set_ylabel(ylabel)
axes.set_xscale(xscale)
axes.set_yscale(yscale)
axes.set_xlim(xlim)
axes.set_ylim(ylim)
if legend:
axes.legend(legend)
axes.grid()
通过这三个用于图形配置的函数,我们定义了plot函数来简洁地绘制多条曲线,因为我们需要在整个书中可视化许多曲线。
#@save
def plot(X, Y=None, xlabel=None, ylabel=None, legend=None, xlim=None,
ylim=None, xscale='linear', yscale='linear',
fmts=('-', 'm--', 'g-.', 'r:'), figsize=(3.5, 2.5), axes=None):
"""绘制数据点。"""
if legend is None:
legend = []
set_figsize(figsize)
axes = axes if axes else d2l.plt.gca()
# 如果 `X` 有一个轴,输出True
def has_one_axis(X):
return (hasattr(X, "ndim") and X.ndim == 1 or isinstance(X, list)
and not hasattr(X[0], "__len__"))
if has_one_axis(X):
X = [X]
if Y is None:
X, Y = [[]] * len(X), X
elif has_one_axis(Y):
Y = [Y]
if len(X) != len(Y):
X = X * len(Y)
axes.cla()
for x, y, fmt in zip(X, Y, fmts):
if len(x):
axes.plot(x, y, fmt)
else:
axes.plot(y, fmt)
set_axes(axes, xlabel, ylabel, xlim, ylim, xscale, yscale, legend)
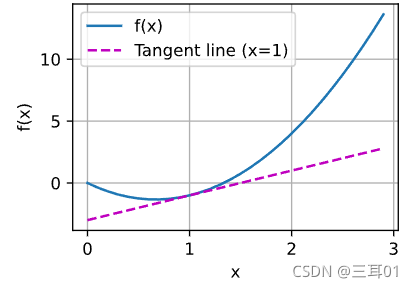
现在我们可以绘制函数 u = f ( x ) u=f(x) u=f(x) 及其在 x = 1 x=1 x=1 处的切线 y = 2 x − 3 y=2 x-3 y=2x−3, 其中系数 2 是切线的斜率。
x = np.arange(0, 3, 0.1)
plot(x, [f(x), 2 * x - 3], 'x', 'f(x)', legend=['f(x)', 'Tangent line (x=1)'])

华为开发者空间,是为全球开发者打造的专属开发空间,汇聚了华为优质开发资源及工具,致力于让每一位开发者拥有一台云主机,基于华为根生态开发、创新。
更多推荐


 10
10 0
0- 0


 已为社区贡献2条内容

所有评论(0)