使用matplotlib颜色图进行颜色循环
·
问题:使用matplotlib颜色图进行颜色循环
如果我通过例如创建颜色:
import numpy as np
from matplotlib import pyplot as plt

n = 6
color = plt.cm.coolwarm(np.linspace(0.1,0.9,n))
color
颜色是一个numpy数组:
array([[ 0.34832334,  0.46571115,  0.88834616,  1.        ],
       [ 0.56518158,  0.69943844,  0.99663507,  1.        ],
       [ 0.77737753,  0.84092121,  0.9461493 ,  1.        ],
       [ 0.93577377,  0.8122367 ,  0.74715647,  1.        ],
       [ 0.96049006,  0.61627642,  0.4954666 ,  1.        ],
       [ 0.83936494,  0.32185622,  0.26492398,  1.        ]])
但是,如果我将 RGB 值(没有 alpha 值 1)作为元组插入到我的.mplstyle文件(map(tuple,color[:,0:-1]))中,我会收到与此类似的错误:
in file "/home/moritz/.config/matplotlib/stylelib/ggplot.mplstyle"
    Key axes.color_cycle: [(0.34832334141176474 does not look like a color arg
  (val, error_details, msg))
任何想法为什么?
解答
编辑 04/2021: 从 matplotlib 2.2.0 开始,密钥axes.color_cycle已被弃用(来源:API 更改)。新方法是使用set_prop_cycle(来源:matplotlib.axes.Axes.set_prop_cycle API)
实际上,详细信息在 matplotlibrc 本身中:它需要一个字符串 rep(十六进制或字母或单词,而不是元组)。
import numpy as np
import matplotlib.pyplot as plt
import matplotlib as mpl
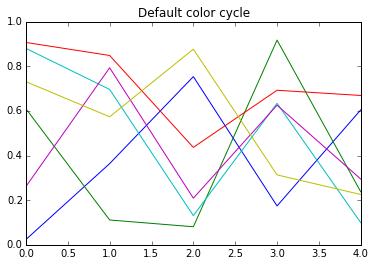
fig, ax1 = plt.subplots(1,1)
ys = np.random.random((5, 6))
ax1.plot(range(5), ys)
ax1.set_title('Default color cycle')
plt.show()
# From the sample matplotlibrc:
#axes.color_cycle : b, g, r, c, m, y, k # color cycle for plot lines
# as list of string colorspecs:
# single letter, long name, or
# web-style hex
# setting color cycle after calling plt.subplots doesn't "take"
# try some hex values as **string** colorspecs
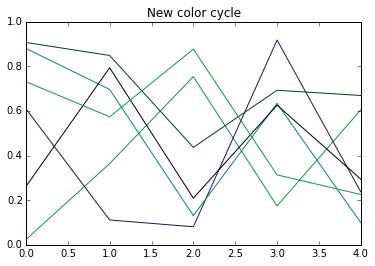
mpl.rcParams['axes.color_cycle'] = ['#129845','#271254', '#FA4411', '#098765', '#000009']
fig, ax2 = plt.subplots(1,1)
ax2.plot(range(5), ys)
ax2.set_title('New color cycle')
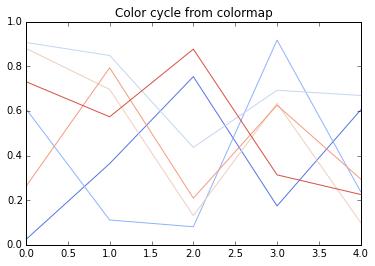
n = 6
color = plt.cm.coolwarm(np.linspace(0.1,0.9,n)) # This returns RGBA; convert:
hexcolor = map(lambda rgb:'#%02x%02x%02x' % (rgb[0]*255,rgb[1]*255,rgb[2]*255),
tuple(color[:,0:-1]))
mpl.rcParams['axes.color_cycle'] = hexcolor
fig, ax3 = plt.subplots(1,1)
ax3.plot(range(5), ys)
ax3.set_title('Color cycle from colormap')
plt.show()

Python社区为您提供最前沿的新闻资讯和知识内容
更多推荐

 0
0 0
0- 0


 已为社区贡献126445条内容

所有评论(0)