为什么 matplotlib 将我的圆圈绘制为椭圆?
·
问题:为什么 matplotlib 将我的圆圈绘制为椭圆?
有没有办法让 matplotlib 绘制一个完美的圆圈?它们看起来更像椭圆形。
解答
只是为了扩展 DSM 的正确答案。默认情况下,绘图沿一个轴比另一轴具有更多像素。当您添加一个圆圈时,它通常以数据单元的形式添加。如果您的轴具有对称范围,这意味着沿 x 轴的一步将涉及与沿 y 轴的一步不同数量的像素。因此,数据单元中的对称圆在您的像素单元中是不对称的(您实际看到的)。
正如 DSM 正确指出的那样,您可以强制 x 和 y 轴每个数据单元具有相同数量的像素。这是使用plt.axis("equal")或ax.axis("equal")方法完成的(其中ax是Axes的一个实例)。
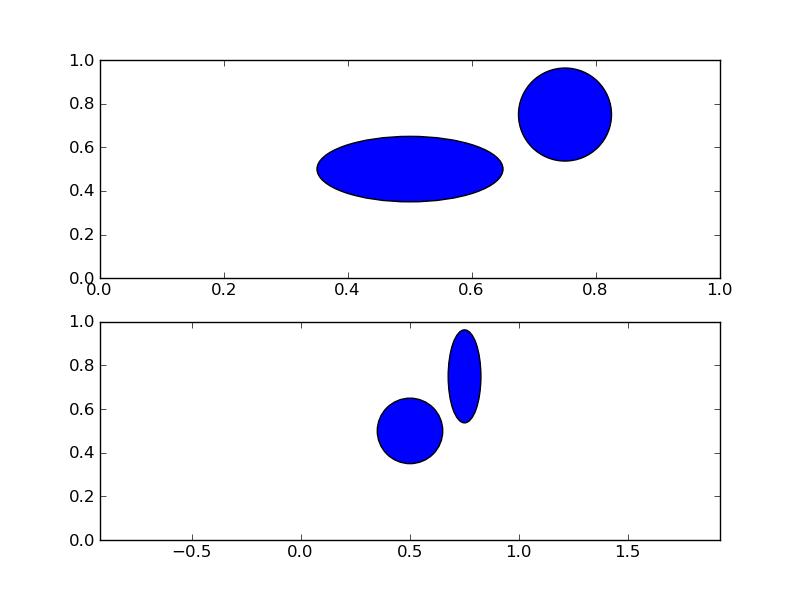
您还可以绘制一个Ellipse,使其适当缩放以在您的绘图上看起来像一个圆圈。这是这种情况的一个例子:
import matplotlib.pyplot as plt
from matplotlib.patches import Ellipse, Circle


fig = plt.figure()
ax1 = fig.add_subplot(211)
# calculate asymmetry of x and y axes:
x0, y0 = ax1.transAxes.transform((0, 0)) # lower left in pixels
x1, y1 = ax1.transAxes.transform((1, 1)) # upper right in pixes
dx = x1 - x0
dy = y1 - y0
maxd = max(dx, dy)
width = .15 * maxd / dx
height = .15 * maxd / dy

# a circle you expect to be a circle, but it is not
ax1.add_artist(Circle((.5, .5), .15))
# an ellipse you expect to be an ellipse, but it's a circle
ax1.add_artist(Ellipse((.75, .75), width, height))
ax2 = fig.add_subplot(212)

ax2.axis('equal')
# a circle you expect to be a circle, and it is
ax2.add_artist(Circle((.5, .5), .15))
# an ellipse you expect to be an ellipse, and it is
ax2.add_artist(Ellipse((.75, .75), width, height))

fig.savefig('perfectCircle1.png')
得到这个数字:
或者,您可以调整您的数字,使Axes是方形的:
# calculate dimensions of axes 1 in figure units
x0, y0, dx, dy = ax1.get_position().bounds
maxd = max(dx, dy)
width = 6 * maxd / dx
height = 6 * maxd / dy

fig.set_size_inches((width, height))

fig.savefig('perfectCircle2.png')
导致:
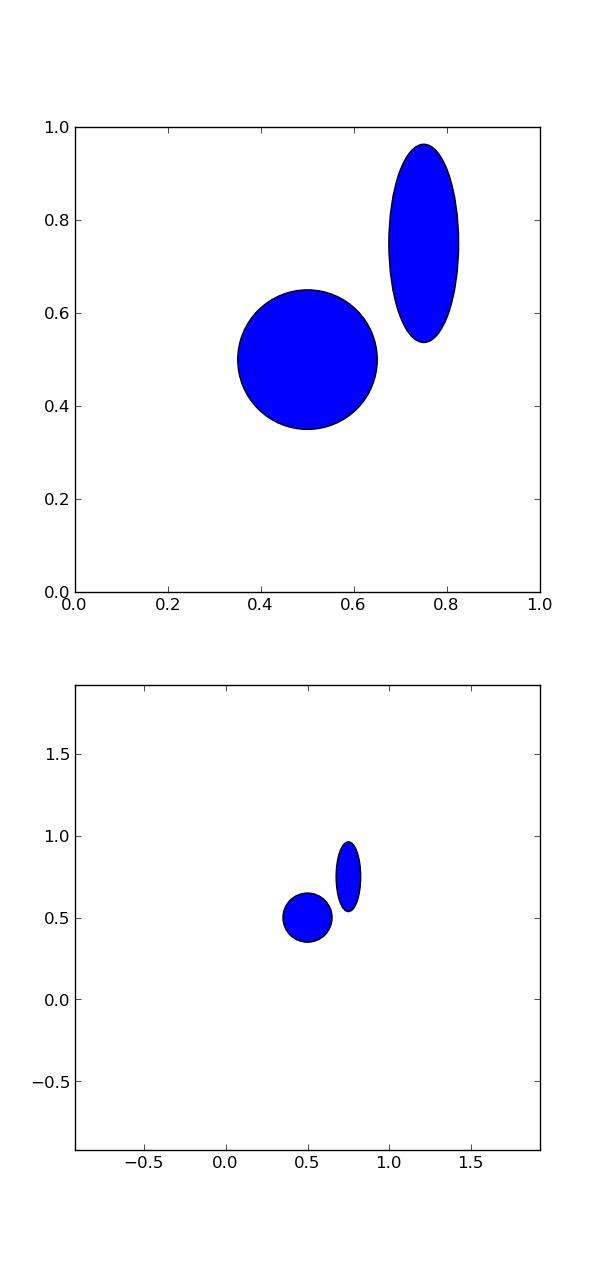
注意具有axis("equal")选项的第二个轴现在在 x 轴和 y 轴上具有相同的范围。该图已按比例缩放,以便每个日期单位由相同数量的像素表示。
您也可以将轴调整为正方形,即使图形不是。或者您可以将 Circle 的默认变换更改为None,这意味着使用的单位是像素。目前我很难成功地做到这一点(圆圈是一个圆圈,但不是我想要的位置)。

Python社区为您提供最前沿的新闻资讯和知识内容
更多推荐

 0
0 0
0- 0


 已为社区贡献126445条内容

所有评论(0)