如何为 Seaborn Heatmap 添加标题和轴标签?
·
问题:如何为 Seaborn Heatmap 添加标题和轴标签?
我想为 seaborn 热图添加标题。使用 Pandas 和 iPython Notebook
代码如下,
a1_p = a1.pivot_table( index='Postcode', columns='Property Type', values='Count', aggfunc=np.mean, fill_value=0)

sns.heatmap(a1_p, cmap="YlGnBu")
数据非常简单:
In [179]: a1_p

Out [179]:
Property Type   Flat    Terraced house  Unknown
Postcode
E1  11  0   0
E14 12  0   0
E1W 6   0   0
E2  6   0   0
解答
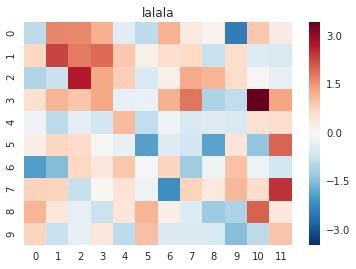
heatmap是一个axes-level 函数,所以你应该可以只使用plt.title或ax.set_title:
%matplotlib inline
import numpy as np
import os
import seaborn as sns
import matplotlib.pyplot as plt

data = np.random.randn(10,12)

ax = plt.axes()
sns.heatmap(data, ax = ax)

ax.set_title('lalala')
plt.show()

更多推荐
 已为社区贡献126445条内容


所有评论(0)