在 python 中绘制熊猫系列的 CDF
·
问题:在 python 中绘制熊猫系列的 CDF
有没有办法做到这一点?我似乎不是一个简单的方法来连接熊猫系列和绘制 CDF。
解答
如果您也对这些值感兴趣,而不仅仅是情节。
import pandas as pd

# If you are in jupyter
%matplotlib inline
这将始终有效(离散和连续分布)
# Define your series
s = pd.Series([9, 5, 3, 5, 5, 4, 6, 5, 5, 8, 7], name = 'value')
df = pd.DataFrame(s)
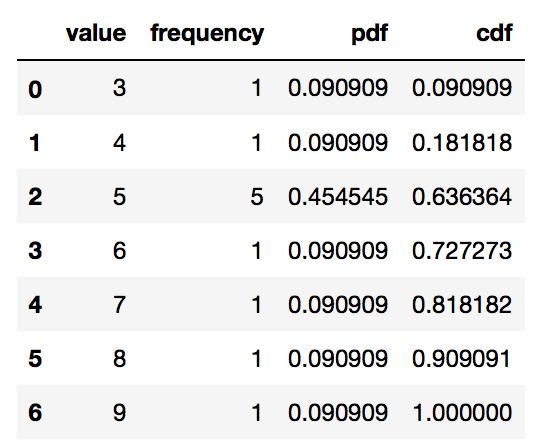
# Get the frequency, PDF and CDF for each value in the series

# Frequency
stats_df = df \
.groupby('value') \
['value'] \
.agg('count') \
.pipe(pd.DataFrame) \
.rename(columns = {'value': 'frequency'})

# PDF
stats_df['pdf'] = stats_df['frequency'] / sum(stats_df['frequency'])

# CDF
stats_df['cdf'] = stats_df['pdf'].cumsum()
stats_df = stats_df.reset_index()
stats_df
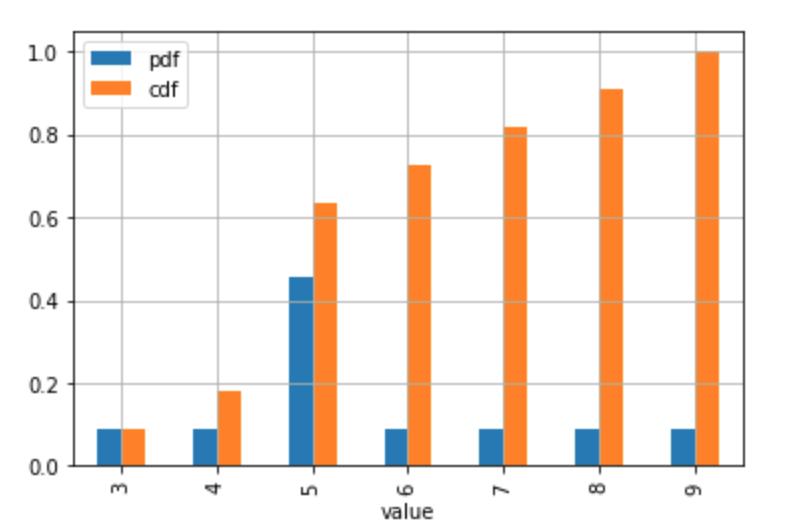
# Plot the discrete Probability Mass Function and CDF.
# Technically, the 'pdf label in the legend and the table the should be 'pmf'
# (Probability Mass Function) since the distribution is discrete.

# If you don't have too many values / usually discrete case
stats_df.plot.bar(x = 'value', y = ['pdf', 'cdf'], grid = True)
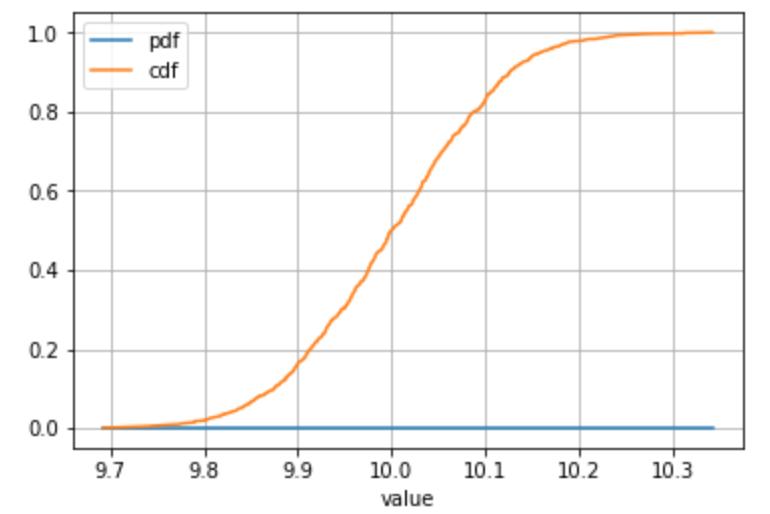
从连续分布中抽取样本的替代示例,或者您有很多单独的值:
# Define your series
s = pd.Series(np.random.normal(loc = 10, scale = 0.1, size = 1000), name = 'value')
# ... all the same calculation stuff to get the frequency, PDF, CDF
# Plot
stats_df.plot(x = 'value', y = ['pdf', 'cdf'], grid = True)
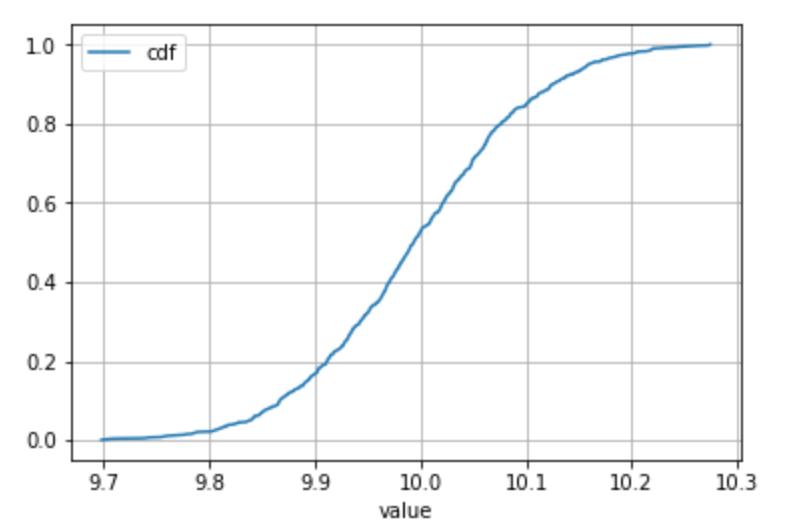
仅适用于连续分布
请注意如果假设样本中每个值只出现一次是非常合理的(通常在连续分布的情况下遇到),则不需要groupby()+agg('count')(因为计数是总是 1)。
在这种情况下,可以使用百分比排名来直接访问 cdf。
走这种捷径时,请使用您的最佳判断力! :)
# Define your series
s = pd.Series(np.random.normal(loc = 10, scale = 0.1, size = 1000), name = 'value')
df = pd.DataFrame(s)
# Get to the CDF directly
df['cdf'] = df.rank(method = 'average', pct = True)
# Sort and plot
df.sort_values('value').plot(x = 'value', y = 'cdf', grid = True)

Python社区为您提供最前沿的新闻资讯和知识内容
更多推荐

 0
0 0
0- 0


 已为社区贡献126440条内容

所有评论(0)