I am trying to customise a colorbar on my matpllotlib contourf plots. Whilst I am able to use scientific notation I am trying to change the base of the notation - essentially so that my ticks would be in the range of (-100,100) rather than (-10,10).
For example, this produces a simple plot...
import numpy as np
import matplotlib.pyplot as plt

z = (np.random.random((10,10)) - 0.5) * 0.2

fig, ax = plt.subplots()
plot = ax.contourf(z)
cbar = fig.colorbar(plot)

cbar.formatter.set_powerlimits((0, 0))
cbar.update_ticks()

plt.show()
like so:
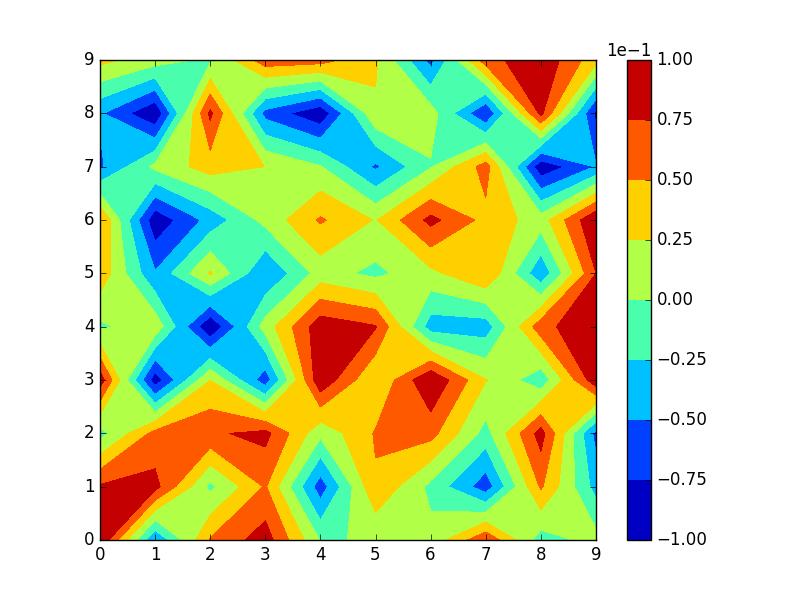
However, I would like the label above the colorbar to be 1e-2 and the numbers to range from -10 to 10.
How would I go about this?
A possible solution can be to subclass the ScalarFormatter and fix the order of magnitude as in this question: Set scientific notation with fixed exponent and significant digits for multiple subplots
You would then call this formatter with the order of magnitude as the argument order, OOMFormatter(-2, mathText=False). mathText is set to false to obtain the notation from the question, i.e.  while setting it to True, would give
  .
.
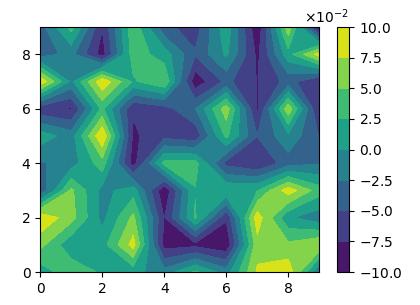
You can then set the formatter to the colorbar via the colorbar's format argument.
import numpy as np; np.random.seed(0)
import matplotlib.pyplot as plt
import matplotlib.ticker

class OOMFormatter(matplotlib.ticker.ScalarFormatter):
    def __init__(self, order=0, fformat="%1.1f", offset=True, mathText=True):
        self.oom = order
        self.fformat = fformat
        matplotlib.ticker.ScalarFormatter.__init__(self,useOffset=offset,useMathText=mathText)
    def _set_order_of_magnitude(self):
        self.orderOfMagnitude = self.oom
    def _set_format(self, vmin=None, vmax=None):
        self.format = self.fformat
        if self._useMathText:
             self.format = r'$\mathdefault{%s}$' % self.format


z = (np.random.random((10,10)) - 0.5) * 0.2

fig, ax = plt.subplots()
plot = ax.contourf(z)
cbar = fig.colorbar(plot, format=OOMFormatter(-2, mathText=False))

plt.show()
For matplotlib versions < 3.1 the class needs to look like this:
class OOMFormatter(matplotlib.ticker.ScalarFormatter):
    def __init__(self, order=0, fformat="%1.1f", offset=True, mathText=True):
        self.oom = order
        self.fformat = fformat
        matplotlib.ticker.ScalarFormatter.__init__(self,useOffset=offset,useMathText=mathText)
    def _set_orderOfMagnitude(self, nothing):
        self.orderOfMagnitude = self.oom
    def _set_format(self, vmin, vmax):
        self.format = self.fformat
        if self._useMathText:
            self.format = '$%s$' % matplotlib.ticker._mathdefault(self.format)


 已为社区贡献126440条内容

所有评论(0)