Answer a question

This would appear to be a duplicate of this question:

Set Colorbar Range in matplotlib

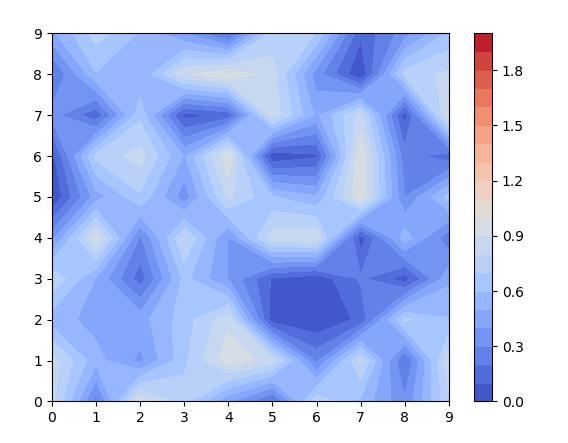
Essentially I want to set the colorbar range to set limits, e.g. 0 to 2. When I use vmin and vmax, the range of colors in contourf is correctly set, but colorbar only shows the clipped range, i.e. the solution in the link doesn't seem to work when using contourf. Am I missing something obvious?

import numpy as np
import matplotlib.pyplot as plt
fld=np.random.rand(10,10)
img=plt.contourf(fld,20,cmap='coolwarm',vmin=0,vmax=2)
plt.colorbar(img)

Resulting in

enter image description here

How can I force the colorbar range to be 0 to 2 with contourf?

Answers

contourf indeed works a bit differently than other ScalarMappables. If you specify the number of levels (20 in this case) it will take them between the minimum and maximum data (approximately). If you want to have n levels between two specific values vmin and vmax you would need to supply those to the contouring function

levels = np.linspace(vmin, vmax, n+1)
plt.contourf(fld,levels=levels,cmap='coolwarm')

Complete code:

import numpy as np
import matplotlib.pyplot as plt
fld=np.random.rand(10,10)
levels = np.linspace(0,2,21)
img=plt.contourf(fld,levels=levels,cmap='coolwarm')
plt.colorbar(img)
plt.show()

enter image description here

Logo

Python社区为您提供最前沿的新闻资讯和知识内容

更多推荐