

There already exist some posts discussing python profiling using cProfile, as well as the challenges of analyzing the output due to the fact that the output file restats from the sample code below is not a plain text file. The snippet below is only a sample from docs.python.org/2/library/profile, and not directly reproducible.
import cProfile
import re
cProfile.run('re.compile("foo|bar")', 'restats')
There is one discussion here: Profile a python script using cProfile into an external file, and on the docs.python.org there are more details on how to analyze the output using pstats.Stats (still only a sample, and not reproducible):
import pstats
p = pstats.Stats('restats')
p.strip_dirs().sort_stats(-1).print_stats()
I may be missing some very important details here, but I would really like to store the output in a pandas DataFrame and do further analysis from there.
I thought it would be pretty simple since the output in iPython from running cProfile.run() looks fairly tidy:
In[]:
cProfile.run('re.compile("foo|bar")'

Out[]:
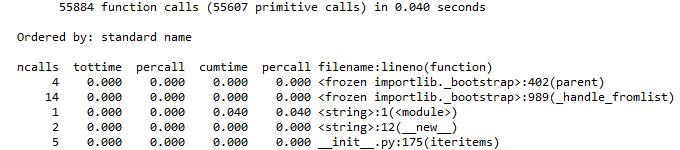
Any suggestions on how to get this into a pandas DataFrame in the same format?


 已为社区贡献126445条内容

所有评论(0)