

I'm plotting a Seaborn heatmap and I want to center the y-axis tick labels, but can't find a way to do this. 'va' text property doesn't seem to be available on yticks().
Considering the following image
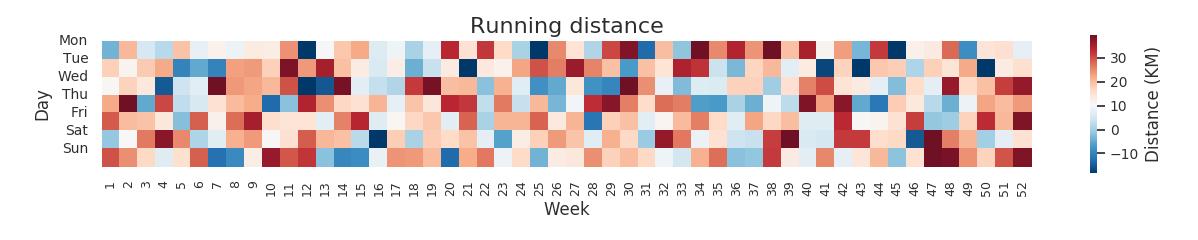 I'd like to align the days of the week to the center of the row of squares
Code to generate this graph:
import pandas as pd
import seaborn as sns
import numpy as np
import matplotlib.pyplot as plt

#Generate dummy data
startDate = '2017-11-25'
dateList = pd.date_range(startDate, periods=365).tolist()
df = pd.DataFrame({'Date': dateList,
                'Distance': np.random.normal(loc=15, scale=15, size=(365,))
              })
#set week and day
df['Week'] = [x.isocalendar()[1] for x in df['Date']]
df['Day'] = [x.isocalendar()[2] for x in df['Date']]

#create dataset for heatmap
#group by axis to plot
df = df.groupby(['Week','Day']).sum().reset_index()
#restructure for heatmap
data = df.pivot("Day","Week","Distance")

#configure the heatmap plot
sns.set()
fig, ax = plt.subplots(figsize=(15,6))
ax=sns.heatmap(data,xticklabels=1,ax = ax, robust=True, square=True,cmap='RdBu_r',cbar_kws={"shrink":.3, "label": "Distance (KM)"})
ax.set_title('Running distance', fontsize=16, fontdict={})

#configure the x and y ticks
plt.xticks(fontsize="9")
plt.yticks(np.arange(7),('Mon','Tue','Wed','Thu','Fri','Sat','Sun'), rotation=0, fontsize="10", va="center")

#set labelsize of the colorbar
cbar = ax.collections[0].colorbar
cbar.ax.tick_params(labelsize=10)

plt.show()


 已为社区贡献126445条内容

所有评论(0)