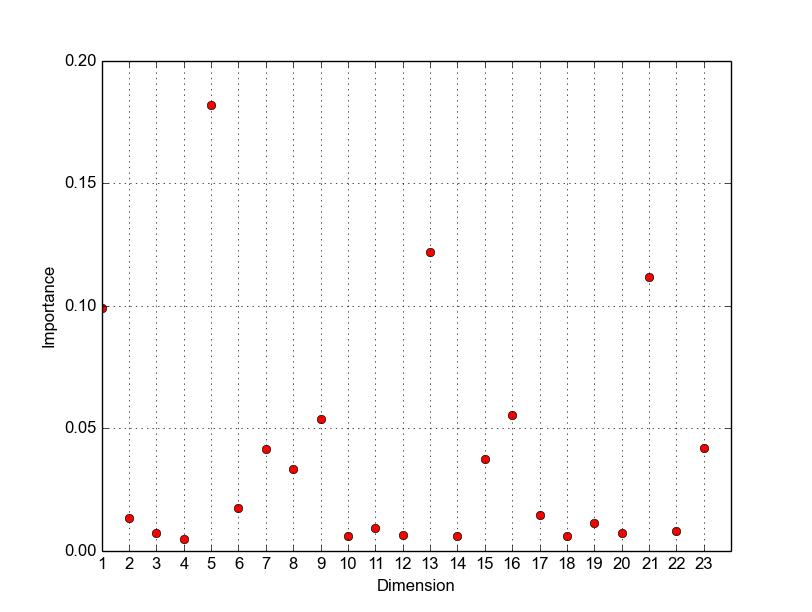
I am trying to plot a vector using python and matplotlib.
My problem is that in matplotlib.pyplot, the x-axis of my data starts with 0 and ends on 23. And in the graph the same is considered.
What I want is that this axis starts with label 1 (it is related to the first y value, or value #0 in natural python indexing) and ends on 24 (related to the last y value, or value #23 in natural python indexing).
I tried pp.xlim(xmin=1), but the problem is that, this way, the first dimension (0) disappears in the graph, and the upper bound continues to be 23. I want it to be 24 and the first y value having its x value labeled as 1 (not 0).
This solution is not working for me. I am trying to have the labels [1,24] in the x-axis of the graph instead of [0,23]. As I wrote, if I start with 1 in x axis using xlim=1 or set_xlim=1, the first y value (dimension 0 of the vector) is not shown in the graph. It starts with second y value (dimension 1 of the vector) and ends with the last value. I don't want it. Here is the source code I am using.
import matplotlib.pyplot as pp
import numpy as np

a=np.array( [0.10478151, 0.09909564, 0.01319826, 0.00743225, 0.00483721, 0.18202419, 0.01732046, 0.04153536, 0.03317991, 0.0536289, 0.00585423, 0.00929871, 0.00629363, 0.12180654, 0.00607781, 0.03752038, 0.05547452, 0.01459015, 0.00604909, 0.01132442, 0.00710363, 0.11159429, 0.0079922, 0.04198672])

pp.xlabel('Dimension')
pp.ylabel('Importance')
ax=pp.subplot(111)
ax.set_xlim(1, 24)
dim=np.arange(1,24,1);
ax.plot(a, 'ro', color='r',linewidth=1.0, label="Graph2")
pp.xticks(dim)
pp.grid()
pp.show()
pp.close()
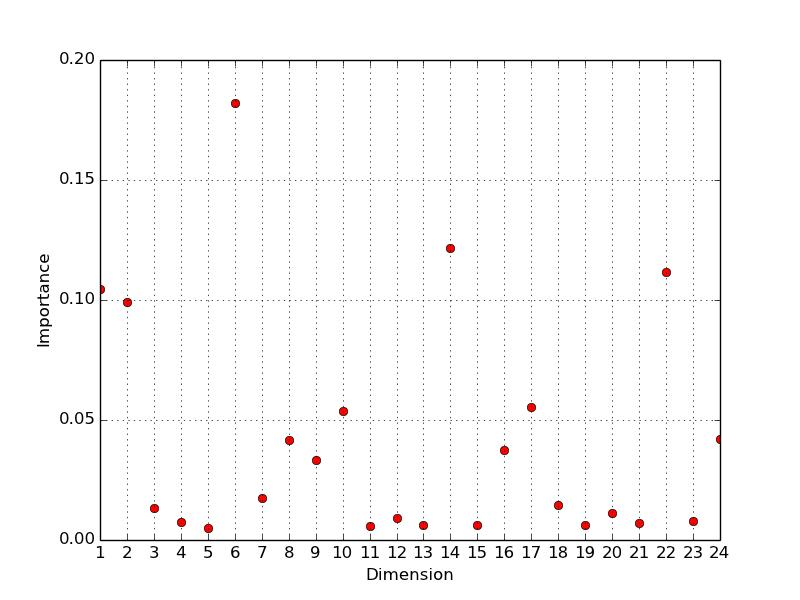
When I run the code, the resulting image is the image below:

It is expected that the first y value will be shown in x=1 and the last in x=24. But Python indexing starts with 0, so, looks like the code is 'shifting' the values, starting in x=2 (or x=1 in python natural indexing).
The solution proposed here does not help me, because it will not show the first value (0). I want all the values shown, but the label MUST start with 1 and end with 24. The problem is that python indexing will start with 0 and ends in 23.
How to deal with this problem in python?


 已为社区贡献126445条内容

所有评论(0)