The following multigraph plots correctly (i.e. parallel edges do not overlap) using graphviz neato to generate a png (as shown in this answer)
import networkx as nx
nx.MultiGraph ([(1,2),(1,2),(1,2),(3,1),(3,2)])
nx.write_dot(Gm,'multi.dot')
!neato -T png multi.dot > multi.png
However using the draw function of Networkx doesn't do the trick
nx.draw_graphviz(Gm,prog='neato')
Is it possible to prevent overlapping edges using the draw methods from Networkx?
Thanks
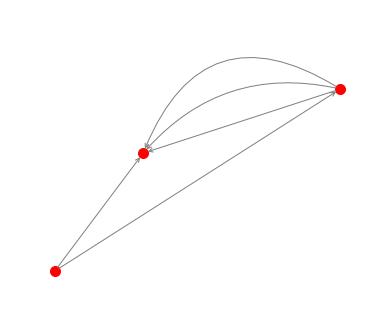
You can use matplotlib directly using the node positions you have calculated.
G=nx.MultiGraph ([(1,2),(1,2),(1,2),(3,1),(3,2)])
pos = nx.random_layout(G)
nx.draw_networkx_nodes(G, pos, node_color = 'r', node_size = 100, alpha = 1)
ax = plt.gca()
for e in G.edges:
    ax.annotate("",
                xy=pos[e[0]], xycoords='data',
                xytext=pos[e[1]], textcoords='data',
                arrowprops=dict(arrowstyle="->", color="0.5",
                                shrinkA=5, shrinkB=5,
                                patchA=None, patchB=None,
                                connectionstyle="arc3,rad=rrr".replace('rrr',str(0.3*e[2])
                                ),
                                ),
                )
plt.axis('off')
plt.show()


 已为社区贡献126446条内容

所有评论(0)