I need to calculate the curl of a vector field and plot it with matplotlib. A simple example of what I am looking for could be put like that:
How can I calculate and plot the curl of the vector field in the quiver3d_demo.py in the matplotlib gallery?
You can use sympy.curl() to calculate the curl of a vector field.
Example:
Suppose F(x,y,z) = y2zi - xyj + z2k, then:
y would be R[1], x is R[0] and z is R[2]- the unit vectors i, j, k of the 3 axes, would be respectively
R.x, R.y, R.z.
The code to calculate the vector field curl is:
from sympy.physics.vector import ReferenceFrame
from sympy.physics.vector import curl
R = ReferenceFrame('R')

F = R[1]**2 * R[2] * R.x - R[0]*R[1] * R.y + R[2]**2 * R.z

G = curl(F, R)
In that case G would be equal to R_y**2*R.y + (-2*R_y*R_z - R_y)*R.z or, in other words,
G = 0i + y2j + (-2yz-y)k.
To plot it you need to convert the above result into 3 separate functions; u,v,w.
(example below adapted from this matplotlib example):
from mpl_toolkits.mplot3d import axes3d
import matplotlib.pyplot as plt
import numpy as np

fig = plt.figure()
ax = fig.gca(projection='3d')

x, y, z = np.meshgrid(np.arange(-0.8, 1, 0.2),
                      np.arange(-0.8, 1, 0.2),
                      np.arange(-0.8, 1, 0.8))

u = 0
v = y**2
w = -2*y*z - y

ax.quiver(x, y, z, u, v, w, length=0.1)

plt.show()
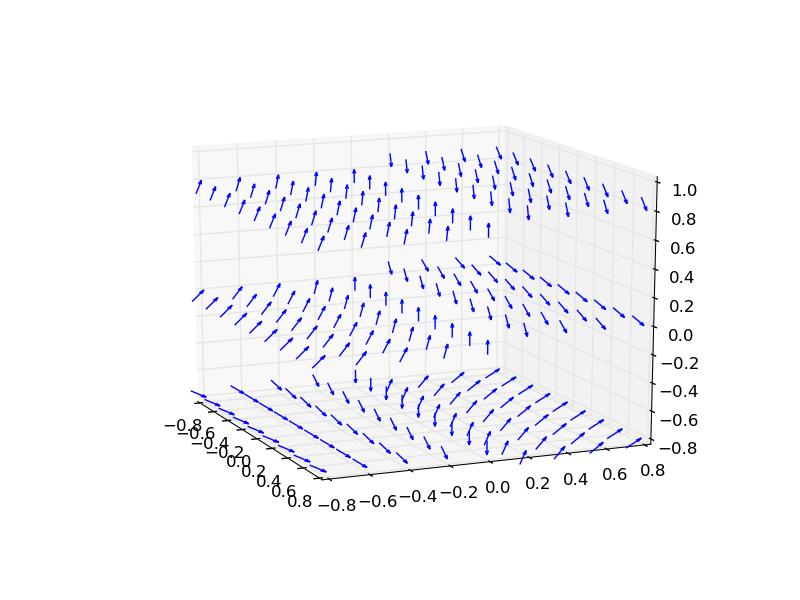
And the final result is this:


 已为社区贡献126442条内容

所有评论(0)