Answer a question

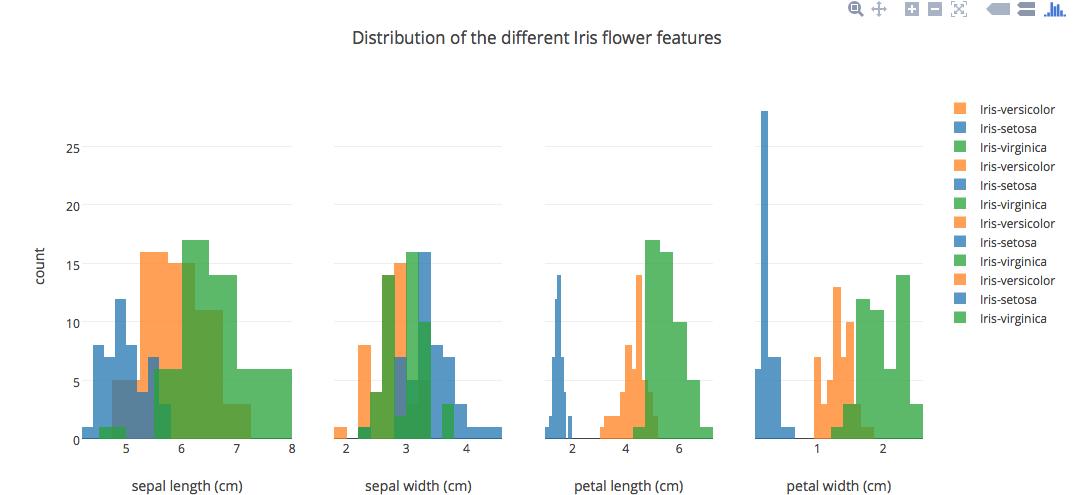
How can I avoid duplicate legend labels in subplots? One way I would go about it in matplotlib would be to pass custom legend labels to an legend object. I couldn't find any documentation for an equivalent option in plotly. Any ideas?

traces = []

colors = {'Iris-setosa': 'rgb(31, 119, 180)', 
          'Iris-versicolor': 'rgb(255, 127, 14)', 
          'Iris-virginica': 'rgb(44, 160, 44)'}

for col in range(4):
    for key in colors:
        traces.append(Histogram(x=X[y==key, col], 
                        opacity=0.75,
                        xaxis='x%s' %(col+1),
                        marker=Marker(color=colors[key]),
                        name=key
                        )
                     )

data = Data(traces)

layout = Layout(barmode='overlay',
                xaxis=XAxis(domain=[0, 0.25], title='sepal length (cm)'),
                xaxis2=XAxis(domain=[0.3, 0.5], title='sepal width (cm)'),
                xaxis3=XAxis(domain=[0.55, 0.75], title='petal length (cm)'),
                xaxis4=XAxis(domain=[0.8, 1], title='petal width (cm)'),
                yaxis=YAxis(title='count'),
                title='Distribution of the different Iris flower features')

fig = Figure(data=data, layout=layout)

py.iplot(fig)

enter image description here

Answers

Plotly controls this on the trace level. Try passing in showlegend=False inside the Histogram traces that you don't want to appear in the legend.

Reference: https://plot.ly/python/reference/#Histogram-showlegend

Example: https://plot.ly/python/legend/#Hiding-Legend-Entries

Direct copy-paste from the link above.

import plotly.plotly as py
from plotly.graph_objs import *
# Fill in with your personal username and API key
# or, use this public demo account
py.sign_in('Python-Demo-Account', 'gwt101uhh0')

trace1 = Scatter(
    x=[0, 1, 2],
    y=[1, 2, 3],
    name='First Trace',
    showlegend=False
)
trace2 = Scatter(
    x=[0, 1, 2, 3],
    y=[8, 4, 2, 0],
    name='Second Trace',
    showlegend=True
)
data = Data([trace1, trace2])
plot_url = py.plot(data, filename='show-legend')

The usage you want to see is shown in trace1 above.

Logo

学AI,认准AI Studio!GPU算力,限时免费领,邀请好友解锁更多惊喜福利 >>>

更多推荐