

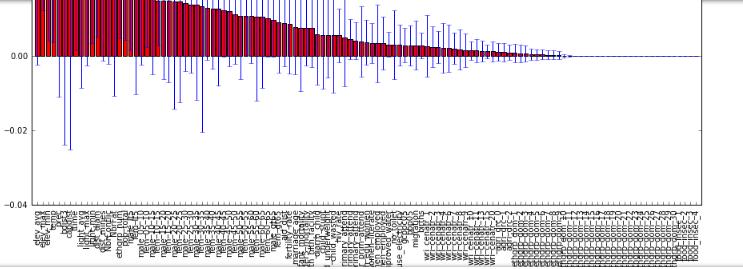
I am trying to plot feature importances for a random forest model and map each feature importance back to the original coefficient. I've managed to create a plot that shows the importances and uses the original variable names as labels but right now it's ordering the variable names in the order they were in the dataset (and not by order of importance). How do I order them in order of feature importance? Thanks!
My code is:
importances = brf.feature_importances_
std = np.std([tree.feature_importances_ for tree in brf.estimators_],
         axis=0)
indices = np.argsort(importances)[::-1]

# Print the feature ranking
print("Feature ranking:")

for f in range(x_dummies.shape[1]):
    print("%d. feature %d (%f)" % (f + 1, indices[f], importances[indices[f]]))

# Plot the feature importances of the forest
plt.figure(figsize=(8,8))
plt.title("Feature importances")
plt.bar(range(x_train.shape[1]), importances[indices],
   color="r", yerr=std[indices], align="center")
feature_names = x_dummies.columns
plt.xticks(range(x_dummies.shape[1]), feature_names)
plt.xticks(rotation=90)
plt.xlim([-1, x_dummies.shape[1]])
plt.show()


 已为社区贡献126445条内容

所有评论(0)