In R there are pre-built functions to plot feature importance of Random Forest model. But in python such method seems to be missing. I search for a method in matplotlib.
model.feature_importances gives me following:
array([  2.32421835e-03,   7.21472336e-04,   2.70491223e-03,
         3.34521084e-03,   4.19443238e-03,   1.50108737e-03,
         3.29160540e-03,   4.82320256e-01,   3.14117333e-03])
Then using following plotting function:
>> pyplot.bar(range(len(model.feature_importances_)), model.feature_importances_)
>> pyplot.show()
I get a barplot but I would like to get barplot with labels while importance showing horizontally in a sorted fashion. I am also exploring seaborn and was not able to find a method.
Not exactly sure what you are looking for. Derived a example from here. As mentioned in the comment: you can change indices to a list of labels at line plt.yticks(range(X.shape[1]), indices) if you want to customize feature labels.
import numpy as np
import matplotlib.pyplot as plt
from sklearn.datasets import make_classification
from sklearn.ensemble import ExtraTreesClassifier
# Build a classification task using 3 informative features
X, y = make_classification(n_samples=1000,
n_features=10,
n_informative=3,
n_redundant=0,
n_repeated=0,
n_classes=2,
random_state=0,
shuffle=False)
# Build a forest and compute the feature importances
forest = ExtraTreesClassifier(n_estimators=250,
random_state=0)
forest.fit(X, y)
importances = forest.feature_importances_
std = np.std([tree.feature_importances_ for tree in forest.estimators_],
axis=0)
indices = np.argsort(importances)
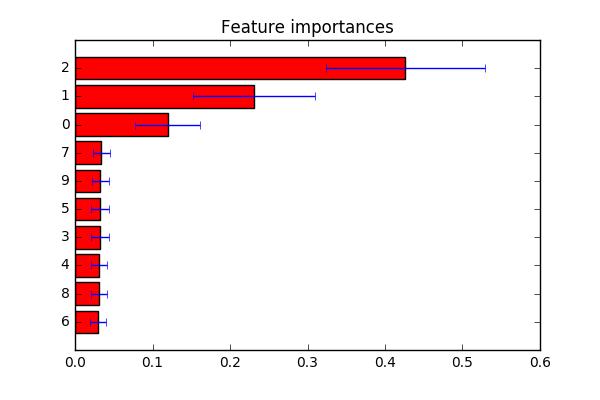
# Plot the feature importances of the forest
plt.figure()
plt.title("Feature importances")
plt.barh(range(X.shape[1]), importances[indices],
color="r", xerr=std[indices], align="center")
# If you want to define your own labels,
# change indices to a list of labels on the following line.
plt.yticks(range(X.shape[1]), indices)
plt.ylim([-1, X.shape[1]])
plt.show()


 已为社区贡献126442条内容

所有评论(0)